RESEARCH SERVICES & LIBRARY New Software Tool Cuts Time to Analyze
advertisement
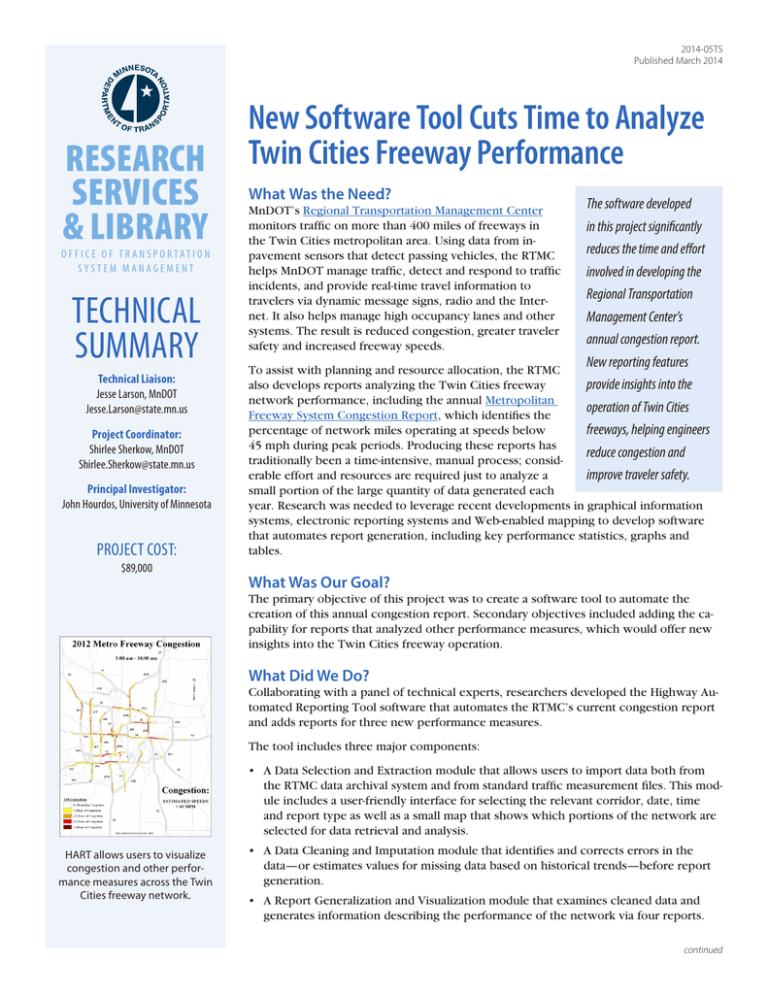
2014-05TS Published March 2014 RESEARCH SERVICES & LIBRARY O FFICE O F TR ANSP O R TATI O N SYSTEM MANAGEMENT TECHNICAL SUMMARY Technical Liaison: Jesse Larson, MnDOT Jesse.Larson@state.mn.us Project Coordinator: Shirlee Sherkow, MnDOT Shirlee.Sherkow@state.mn.us Principal Investigator: John Hourdos, University of Minnesota PROJECT COST: $89,000 New Software Tool Cuts Time to Analyze Twin Cities Freeway Performance What Was the Need? MnDOT’s Regional Transportation Management Center monitors traffic on more than 400 miles of freeways in the Twin Cities metropolitan area. Using data from inpavement sensors that detect passing vehicles, the RTMC helps MnDOT manage traffic, detect and respond to traffic incidents, and provide real-time travel information to travelers via dynamic message signs, radio and the Internet. It also helps manage high occupancy lanes and other systems. The result is reduced congestion, greater traveler safety and increased freeway speeds. The software developed in this project significantly reduces the time and effort involved in developing the Regional Transportation Management Center’s annual congestion report. New reporting features provide insights into the operation of Twin Cities freeways, helping engineers reduce congestion and improve traveler safety. To assist with planning and resource allocation, the RTMC also develops reports analyzing the Twin Cities freeway network performance, including the annual Metropolitan Freeway System Congestion Report, which identifies the percentage of network miles operating at speeds below 45 mph during peak periods. Producing these reports has traditionally been a time-intensive, manual process; considerable effort and resources are required just to analyze a small portion of the large quantity of data generated each year. Research was needed to leverage recent developments in graphical information systems, electronic reporting systems and Web-enabled mapping to develop software that automates report generation, including key performance statistics, graphs and tables. What Was Our Goal? The primary objective of this project was to create a software tool to automate the creation of this annual congestion report. Secondary objectives included adding the capability for reports that analyzed other performance measures, which would offer new insights into the Twin Cities freeway operation. What Did We Do? Collaborating with a panel of technical experts, researchers developed the Highway Automated Reporting Tool software that automates the RTMC’s current congestion report and adds reports for three new performance measures. The tool includes three major components: • A Data Selection and Extraction module that allows users to import data both from the RTMC data archival system and from standard traffic measurement files. This module includes a user-friendly interface for selecting the relevant corridor, date, time and report type as well as a small map that shows which portions of the network are selected for data retrieval and analysis. HART allows users to visualize congestion and other performance measures across the Twin Cities freeway network. • A Data Cleaning and Imputation module that identifies and corrects errors in the data—or estimates values for missing data based on historical trends—before report generation. • A Report Generalization and Visualization module that examines cleaned data and generates information describing the performance of the network via four reports. continued “Before HART, it took months to analyze freeway performance using data from only the month of October. Now engineers can quickly analyze data from any time period, significantly improving traffic planning.” —Jesse Larson, Assistant Freeway Operations Engineer, MnDOT Metro District Regional Transportation Management Center “HART is an important first step toward integrating, automating and improving the reporting tools and methodologies used to examine the Twin Cities freeway network.” —John Hourdos, Director, Minnesota Traffic Observatory, University of Minnesota From the RTMC’s control room, engineers can monitor and manage Twin Cities freeway traffic using data from thousands of in-pavement sensors. Each report is tabulated within HART and written to a geospatial database designed to store data tied to geographical features. Using this data, HART automatically maps the freeway network and uses color-coding to visualize congestion and other performance measures. These maps automatically update with each use of HART, dramatically reducing the time required to update and correct report visualizations. What Did We Learn? HART allows users to retrieve necessary traffic data from RTMC servers and automatically generates four reports: • S peed-Based Congestion, which automates the RTMC’s existing methods for generating the annual congestion report, focusing on recurring congestion throughout the network. • C ongestion Intensity, which extends the congestion report to account for the number of lanes present across the network and highlights severe congestion at multilane segments of the system. • L ost and Available Capacity, which identifies the potential capacity that is lost during congested conditions and the spare capacity that is available for locations that do not currently experience congestion. This report in particular has the potential to help direct planning and investment to the locations across the system that have the most promise for efficiency improvement. • M aximum Total Throughput, which maps usage patterns across the network at peak times. The three new reports extend the performance-based management toolbox available for MnDOT engineers and planners to better examine congestion, the behavior of bottleneck locations and the potential benefits of network investments. What’s Next? Produced by CTC & Associates for: Minnesota Department of Transportation Research Services & Library MS 330, First Floor 395 John Ireland Blvd. St. Paul, MN 55155-1899 651-366-3780 www.mndot.gov/research HART has been implemented at the RTMC and is being used to generate the 2013 congestion report. Beyond its built-in reporting features, HART allows users to integrate new performance measures as planning and management needs evolve. Its data-cleaning algorithms can also be updated to increase accuracy. Finally, HART’s code was written in a medium compatible with the rest of the RTMC suite of applications so it can be easily maintained and updated to introduce new methodologies and performance measures. Overall, the system will significantly reduce the amount of effort involved in generating freeway performance reports while providing a robust foundation for the addition of new features. This Technical Summary pertains to Report 2014-05, “Expanding and Streamlining of RTMC Freeway Network Performance Reporting Methodologies and Tools,” published January 2014. The full report can be accessed at http://www.lrrb.org/PDF/201405.pdf.
