Putting Research into Practice: Developing a Congestion Report for Arterial Roads
advertisement
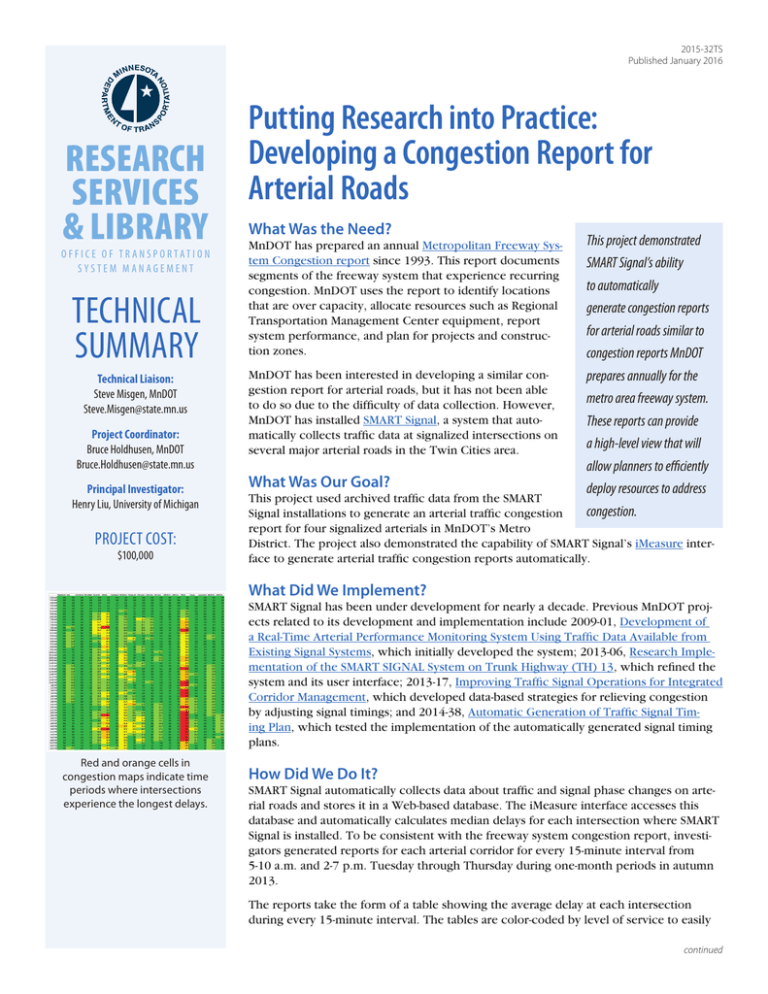
2015-32TS Published January 2016 RESEARCH SERVICES & LIBRARY O FFICE O F TR ANSP O R TATI O N SYSTEM MANAGEMENT TECHNICAL SUMMARY Technical Liaison: Steve Misgen, MnDOT Steve.Misgen@state.mn.us Project Coordinator: Bruce Holdhusen, MnDOT Bruce.Holdhusen@state.mn.us Principal Investigator: Henry Liu, University of Michigan PROJECT COST: $100,000 Putting Research into Practice: Developing a Congestion Report for Arterial Roads What Was the Need? MnDOT has prepared an annual Metropolitan Freeway System Congestion report since 1993. This report documents segments of the freeway system that experience recurring congestion. MnDOT uses the report to identify locations that are over capacity, allocate resources such as Regional Transportation Management Center equipment, report system performance, and plan for projects and construction zones. MnDOT has been interested in developing a similar congestion report for arterial roads, but it has not been able to do so due to the difficulty of data collection. However, MnDOT has installed SMART Signal, a system that automatically collects traffic data at signalized intersections on several major arterial roads in the Twin Cities area. What Was Our Goal? This project demonstrated SMART Signal’s ability to automatically generate congestion reports for arterial roads similar to congestion reports MnDOT prepares annually for the metro area freeway system. These reports can provide a high-level view that will allow planners to efficiently deploy resources to address congestion. This project used archived traffic data from the SMART Signal installations to generate an arterial traffic congestion report for four signalized arterials in MnDOT’s Metro District. The project also demonstrated the capability of SMART Signal’s iMeasure interface to generate arterial traffic congestion reports automatically. What Did We Implement? SMART Signal has been under development for nearly a decade. Previous MnDOT projects related to its development and implementation include 2009-01, Development of a Real-Time Arterial Performance Monitoring System Using Traffic Data Available from Existing Signal Systems, which initially developed the system; 2013-06, Research Implementation of the SMART SIGNAL System on Trunk Highway (TH) 13, which refined the system and its user interface; 2013-17, Improving Traffic Signal Operations for Integrated Corridor Management, which developed data-based strategies for relieving congestion by adjusting signal timings; and 2014-38, Automatic Generation of Traffic Signal Timing Plan, which tested the implementation of the automatically generated signal timing plans. Red and orange cells in congestion maps indicate time periods where intersections experience the longest delays. How Did We Do It? SMART Signal automatically collects data about traffic and signal phase changes on arterial roads and stores it in a Web-based database. The iMeasure interface accesses this database and automatically calculates median delays for each intersection where SMART Signal is installed. To be consistent with the freeway system congestion report, investigators generated reports for each arterial corridor for every 15-minute interval from 5-10 a.m. and 2-7 p.m. Tuesday through Thursday during one-month periods in autumn 2013. The reports take the form of a table showing the average delay at each intersection during every 15-minute interval. The tables are color-coded by level of service to easily continued “Every year our freeway system produces a congestion report for the metro area freeway system that we use to identify the most congested areas and allocate resources to these areas. We wanted to develop a similar report for our arterial roads.” —Steve Misgen, Traffic Engineer, MnDOT Metro District The iMeasure interface allows users to access data and automatically generate congestion reports for any intersection or corridor where SMART Signal is installed, during any day of the week and any time of the day. show congested intersections and times. Separate congestion maps detail the level of congestion on mainline roads and minor approaches. “The innovative part of this project is that the congestion report is automatically generated. Once the SMART Signal system is installed, there’s no additional process necessary to access the data or the congestion report through iMeasure.” —Henry Liu, Professor, University of Michigan Transportation Research Institute Produced by CTC & Associates for: Minnesota Department of Transportation Research Services & Library MS 330, First Floor 395 John Ireland Blvd. St. Paul, MN 55155-1899 651-366-3780 www.mndot.gov/research Investigators selected level of service as an indicator to represent congestion levels. The level of service can range from A (an average delay of 10 seconds per vehicle or less) to F (average delay of more than 80 seconds per vehicle). A signalized approach is considered congested if it has a level of service of D or worse (average delay greater than 35 seconds per vehicle). What Was the Impact? The four corridors where SMART Signal is installed have a total of 46 intersections and 92 main approaches. In general, these main approaches operate efficiently during peak hours. Only 25 approaches are considered congested at any point during the day. Of these, most intersections are only congested during limited time periods. Only six experienced more than two hours of congestion per day. Minor approaches, where vehicles on side streets cross or enter the arterial road, experience more and larger delays. MnDOT has now installed the system on three additional corridors in the Metro District as well as one in District 3. What’s Next? MnDOT hopes to continue installing the system on all 15 major arterials in the Metro District, and the system also has potential for corridors in other districts. As the system is installed on more corridors, it will provide a high-level view for planners to identify the most severely congested signalized arterial corridors in the Metro District and elsewhere. MnDOT does need to determine whether the definition of “congested” for arterial roads is comparable to the definition used in the freeway system congestion report. The report uses 45 mph travel speeds as a congestion threshold. Since that is the maximum speed limit on arterial roads, an apples-to-apples comparison is not possible, but MnDOT wants to determine if its level of service based definition is the most effective option. A startup company is commercializing SMART Signal. As a result, there will likely be no further MnDOT research projects to develop or implement the system. This Technical Summary pertains to Report 2015-32, “Develop Annual Arterial Congestion Report,” published June 2015. The full report can be accessed at mndot.gov/research/TS/2015/201532.pdf.
