UCL Student Statistics Table B 2011-12
advertisement
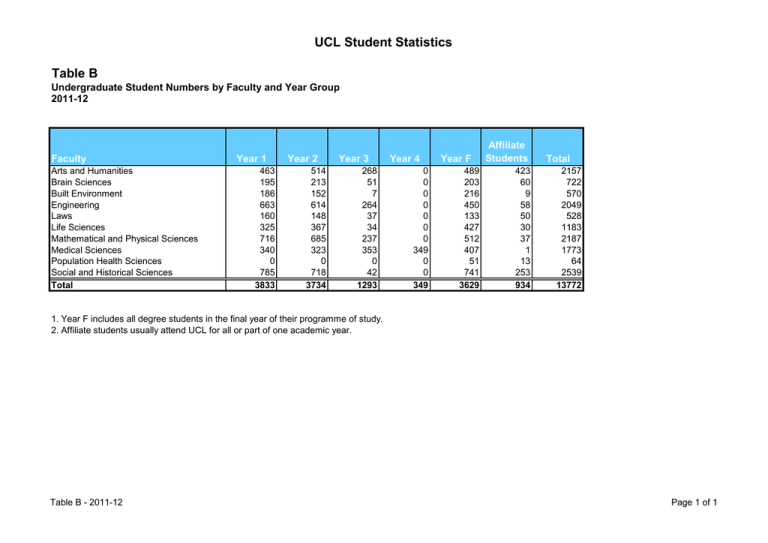
UCL Student Statistics Table B Undergraduate Student Numbers by Faculty and Year Group 2011-12 Faculty Arts and Humanities Brain Sciences Built Environment Engineering Laws Life Sciences Mathematical and Physical Sciences Medical Sciences Population Health Sciences Social and Historical Sciences Total Year 1 463 195 186 663 160 325 716 340 0 785 3833 Year 2 514 213 152 614 148 367 685 323 0 718 3734 Year 3 268 51 7 264 37 34 237 353 0 42 1293 Year 4 0 0 0 0 0 0 0 349 0 0 349 Year F 489 203 216 450 133 427 512 407 51 741 3629 Affiliate Students 423 60 9 58 50 30 37 1 13 253 934 Total 2157 722 570 2049 528 1183 2187 1773 64 2539 13772 1. Year F includes all degree students in the final year of their programme of study. 2. Affiliate students usually attend UCL for all or part of one academic year. Table B - 2011-12 Page 1 of 1
