FUNDING STREAMS INITIATIVE SUMMARY REPORT January 24, 2011
advertisement
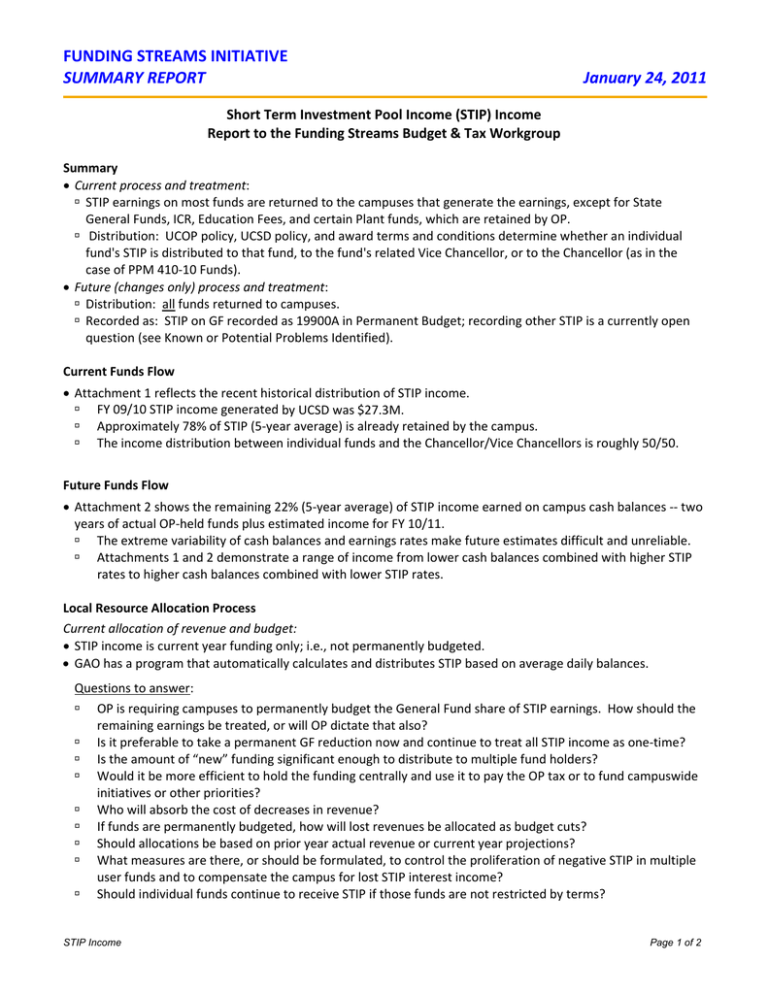
FUNDING STREAMS INITIATIVE SUMMARY REPORT January 24, 2011 Short Term Investment Pool Income (STIP) Income Report to the Funding Streams Budget & Tax Workgroup Summary Current process and treatment: STIP earnings on most funds are returned to the campuses that generate the earnings, except for State General Funds, ICR, Education Fees, and certain Plant funds, which are retained by OP. Distribution: UCOP policy, UCSD policy, and award terms and conditions determine whether an individual fund's STIP is distributed to that fund, to the fund's related Vice Chancellor, or to the Chancellor (as in the case of PPM 410‐10 Funds). Future (changes only) process and treatment: Distribution: all funds returned to campuses. Recorded as: STIP on GF recorded as 19900A in Permanent Budget; recording other STIP is a currently open question (see Known or Potential Problems Identified). Current Funds Flow Attachment 1 reflects the recent historical distribution of STIP income. FY 09/10 STIP income generated by UCSD was $27.3M. Approximately 78% of STIP (5‐year average) is already retained by the campus. The income distribution between individual funds and the Chancellor/Vice Chancellors is roughly 50/50. Future Funds Flow Attachment 2 shows the remaining 22% (5‐year average) of STIP income earned on campus cash balances ‐‐ two years of actual OP‐held funds plus estimated income for FY 10/11. The extreme variability of cash balances and earnings rates make future estimates difficult and unreliable. Attachments 1 and 2 demonstrate a range of income from lower cash balances combined with higher STIP rates to higher cash balances combined with lower STIP rates. Local Resource Allocation Process Current allocation of revenue and budget: STIP income is current year funding only; i.e., not permanently budgeted. GAO has a program that automatically calculates and distributes STIP based on average daily balances. Questions to answer: OP is requiring campuses to permanently budget the General Fund share of STIP earnings. How should the remaining earnings be treated, or will OP dictate that also? Is it preferable to take a permanent GF reduction now and continue to treat all STIP income as one‐time? Is the amount of “new” funding significant enough to distribute to multiple fund holders? Would it be more efficient to hold the funding centrally and use it to pay the OP tax or to fund campuswide initiatives or other priorities? Who will absorb the cost of decreases in revenue? If funds are permanently budgeted, how will lost revenues be allocated as budget cuts? Should allocations be based on prior year actual revenue or current year projections? What measures are there, or should be formulated, to control the proliferation of negative STIP in multiple user funds and to compensate the campus for lost STIP interest income? Should individual funds continue to receive STIP if those funds are not restricted by terms? STIP Income Page 1 of 2 FUNDING STREAMS INITIATIVE SUMMARY REPORT January 24, 2011 Central Campus Processes Annual revenue estimates for budgeting purposes. Campuses are supposed to permanently budget projected increases in revenue for General Funds only (at least at this time). Estimates on cash balances provide by General Accounting or CBO?? Estimated annual STIP rate provided by General Accounting or CBO?? If CBO not the owner of data, when should it be provided to the CBO ‐‐ by February 1 each year?? CBO is owner of permanent budget, thus responsible for recording permanent increases and decreases. Who is responsible for reconciling permanent budget to actual receipts? Known or Potential Problems Identified The decentralization of General Funds STIP is non‐neutral because campuses are responsible for covering any potential shortfalls. The 2010/11 budget was signed in October (3 months into the current fiscal year) and it is possible the campus could receive negative STIP associated with the State Claim Deferral. FY 10/11 Information is pending from OP; however, the negative STIP impact from the prior two years has been $6.3M in FY 08/09 and $7.9M in FY 09/10 (UCSD shares would be ~$750k and ~$940k, respectively). At this time, only STIP income on General Funds is to be swapped with State GF dollars. However, there is indication from UCOP that a reduction in State GF may be forthcoming in FY 11/12 corresponding to the balance of STIP income on other funds. OP calculates STIP on the basis of monthly average balances, but UCSD calculates STIP on daily cash balances resulting in differences that must be reconciled. For the OP‐retained STIP, the variances have been posted against the Chancellor’s account. Because the campus STIP distribution process is limited to the fund, negative STIP on multiple user funds, such as General Funds and ICR Funds, has been covered with central campus resources; thus, departments that overspend multiple user funds have done so without consequence. Lack of automated programming for monitoring cash balances and distribution of negative STIP at the organization level for multiple user funds. Open questions at UCOP: a) does all income retain source fund tag or can it be distributed per existing STIP fund practice (each VC has a designated discretionary fund #); b) will all funds be considered permanent or one‐ time funding; and c) what is the estimated negative STIP on State GF in FY 10/11? STIP Income Page 2 of 2 ATTACHMENT 1 STIP INCOME DISTRIBUTION TO UCSD FROM UCOP FY 05/06 THRU FY 09/10 ‐‐ BY VC UNIT ORGANIZATION SUMMARY OF STIP TOTAL INCOME AND VICE CHANCELLOR DISCRETIONARY SHARE FY 2005/06 VC UNIT ORGANIZATION VC TOTAL FY 2006/07 % of Total FY 2007/08 % of Total VC TOTAL 2,502,814 2,504,896 6.3% TOTAL 3,195,707 3,197,804 7.8% VC (3‐yr avg ) TOTAL (1),(2) % of Total 2,823,094 2,825,366 8.4% 12.6% ‐ 3,547,499 5,541,708 13.5% 2,021,255 1,194,525 1,541,890 3.8% 2.4% 367,157 1,072,428 4,119,912 10.4% 3,979,513 1,073,282 3,023,907 7.7% 1,206,304 3,956,482 556,391 ‐ 15,327,100 29,788,904 75.4% FY 2009/10 VC (3‐yr avg ) TOTAL (1),(2) % of Total 4,727,943 4,731,747 17.3% 10.5% ‐ 4,348,368 15.9% 2,058,195 6.1% ‐ ‐ 0.0% 1,495,284 1,970,426 5.9% 1,041,810 1,372,856 5.0% 2.6% 222,966 669,976 2.0% 581,838 1,748,326 6.4% 4,726,850 11.5% 2,903,334 3,477,606 10.3% 1,724,485 2,065,583 7.6% 1,101,581 2,776,107 6.8% 2,549,588 6,885,259 20.5% 1,566,840 4,231,310 15.5% 10.0% 1,427,579 4,341,563 10.6% 1,079,995 3,413,157 10.1% 644,331 2,036,307 7.5% 640,601 1.6% 631,907 658,538 1.6% 501,225 555,687 1.7% 226,937 251,596 0.9% 3,170,955 8.0% ‐ 3,298,786 8.0% ‐ 1,912,395 5.7% ‐ 1,358,027 5.0% 17,342,313 32,346,428 78.7% 13,596,742 27,315,566 81.2% 10,514,183 22,144,120 81.0% 2,168,759 2,170,911 MEDICAL CENTER ‐ 3,555,027 10.5% ‐ 4,678,926 11.8% ‐ 5,190,755 EXTERNAL RELATIONS 3,486,091 3,566,167 10.6% 5,238,627 5,320,133 13.5% 5,444,344 STUDENT AFFAIRS 963,838 1,274,533 3.8% 1,047,279 1,407,845 3.6% RESOURCE MGMT & PLNG 263,794 778,943 2.3% 306,410 965,246 ACADEMIC AFFAIRS 2,965,309 3,539,438 10.5% 3,395,993 EXT & BUSINESS AFFAIRS 950,269 2,639,521 7.8% HEALTH SCIENCE 1,211,978 3,856,204 11.4% MARINE SCIENCE 500,437 573,091 1.7% CW AND PLANT ‐ 3,243,207 9.6% 12,510,475 25,197,043 74.7% ACTUAL REVENUE XFERRED TO UCSD % of Total VC CHANCELLOR 6.4% FY 2008/09 (3) OFFICE OF THE PRESIDENT ‐ % of Funds Retained by OP TOTAL STIP Annualized STIP Rate (OP) 8,530,890 ‐ 25.3% 12,510,475 33,727,933 3.80% 9,728,596 ‐ 24.6% 100.0% 15,327,100 39,517,500 4.18% 100.0% 8,755,941 6,337,104 5,180,232 21.3% 18.8% 19.0% 17,342,313 41,102,370 4.35% 100.0% 13,596,742 33,652,670 3.33% 100.0% 10,514,183 27,324,352 2.40% Notes (blue type indicates derived data) (1) The VC Share of FY 08/09‐FY 09/10 STIP income is extrapolated based upon actual totals (reports from GAO) and average VC share for the 3‐year period FY 05/06‐FY 07/08 (0506‐0708 data taken from IFIS ledger) For example, the VCMS retained ~90% of STIP income during the 3‐year period, so that % share is applied to 07/08 and 08/09. The remainder is allocated to individual funds (2) FY 08/09 & FY 09/10 STIP are reported before adjustments for the STIP Loan in order to have a reasonable basis for comparison (3) There is a discrepancy in OP retained STIP (FY 08/09 & FY 09/10) between UCOP reports and UCSD's GAO reports. This table uses UCOP numbers ‐‐ the difference is taken from the Chancellor, which is the current practice in accounting for adjustments FSI Summary STIP Income 1/24/11 CBO 100.0% ATTACHMENT 2 OP‐RETAINED STIP INCOME FUND GENERAL FUNDS ED FEE FUND ICR FUNDS OTHER FUNDS PLANT FUNDS TOTAL OP RETAINED STIP Annualized STIP Rate (OP) Actuals FY 2008‐09 3,399,367 645,695 1,086,370 12,636 1,193,035 6,337,104 3.33% Actuals FY 2009‐10 2,669,324 303,067 1,306,459 11,652 889,731 5,180,232 Estimates FY 2010‐11 2,793,485 452,786 1,234,178 10,865 934,562 5,425,876 2.40% 2.54% Notes (blue type indicates derived data) FY 2010‐11 estimates based on the following assumptions: ‐ Q 1 actuals for GF, Ed Fee, & ICR (total $899k; STIP rate of 2.67%) ‐ Qs 2‐4 based on average cash balances from two prior years of same quarter multiplied by assumed 2.5% STIP rate for remainder of year. Other Funds and Plant Funds have not been received yet, so are also estimated this way, including Q1. FSI Summary STIP Income 1/24/11 CBO
