Math 3900 Spring 2009 Homework 4, due February 13
advertisement
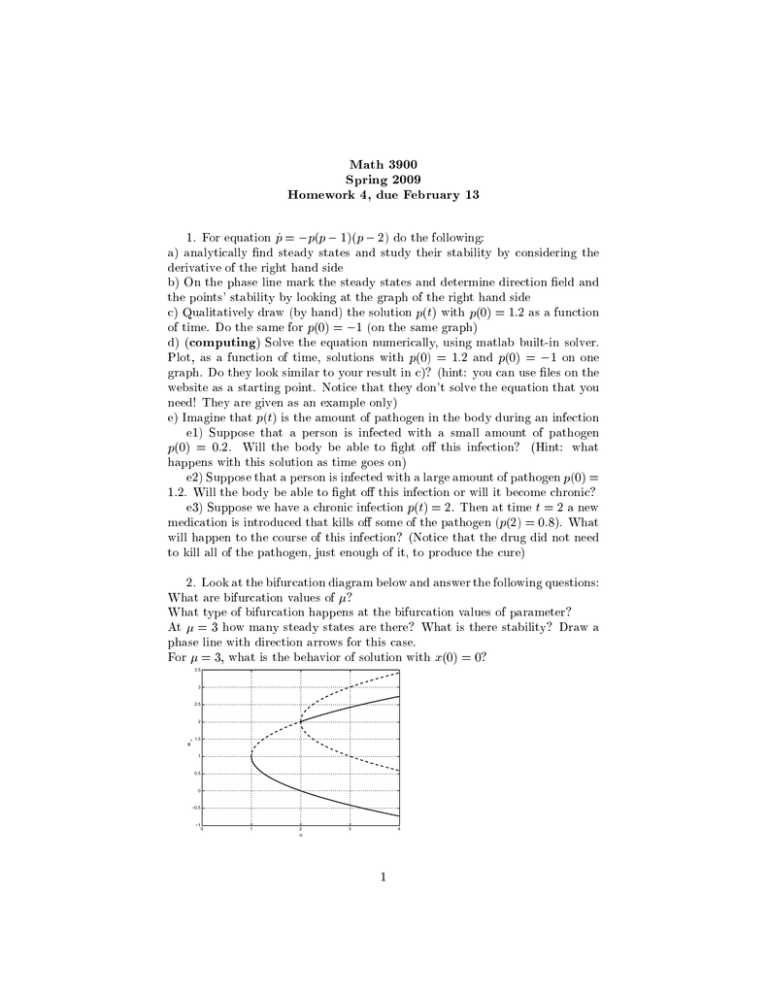
Math 3900 Spring 2009 Homework 4, due February 13 1. For equation p_ = p(p 1)(p 2) do the following: a) analytically nd steady states and study their stability by considering the derivative of the right hand side b) On the phase line mark the steady states and determine direction eld and the points' stability by looking at the graph of the right hand side c) Qualitatively draw (by hand) the solution p(t) with p(0) = 1:2 as a function of time. Do the same for p(0) = 1 (on the same graph) d) (computing) Solve the equation numerically, using matlab built-in solver. Plot, as a function of time, solutions with p(0) = 1:2 and p(0) = 1 on one graph. Do they look similar to your result in c)? (hint: you can use les on the website as a starting point. Notice that they don't solve the equation that you need! They are given as an example only) e) Imagine that p(t) is the amount of pathogen in the body during an infection e1) Suppose that a person is infected with a small amount of pathogen p(0) = 0:2. Will the body be able to ght o this infection? (Hint: what happens with this solution as time goes on) e2) Suppose that a person is infected with a large amount of pathogen p(0) = 1:2. Will the body be able to ght o this infection or will it become chronic? e3) Suppose we have a chronic infection p(t) = 2. Then at time t = 2 a new medication is introduced that kills o some of the pathogen (p(2) = 0:8). What will happen to the course of this infection? (Notice that the drug did not need to kill all of the pathogen, just enough of it, to produce the cure) 2. Look at the bifurcation diagram below and answer the following questions: What are bifurcation values of ? What type of bifurcation happens at the bifurcation values of parameter? At = 3 how many steady states are there? What is there stability? Draw a phase line with direction arrows for this case. For = 3, what is the behavior of solution with x(0) = 0? 3.5 3 2.5 2 x * 1.5 1 0.5 0 −0.5 −1 0 1 2 µ 3 4 1 3. Consider the following system x_ = x2 x y_ = x y y a) Draw nullclines. Mark steady states on the graph b) (computing)In matlab solve this system numerically starting with (x(0); y(0)) = ( 0:3; 0:3) for t from 0 to 10. Plot the solution in phase plane and also as a function of time. Don't forget to label axes and to include a legend. You can use les included on the website as a basis for your code, but you will need to modify them slightly. 2
