Math 1090.04 Homework 03 Spring 2013
advertisement
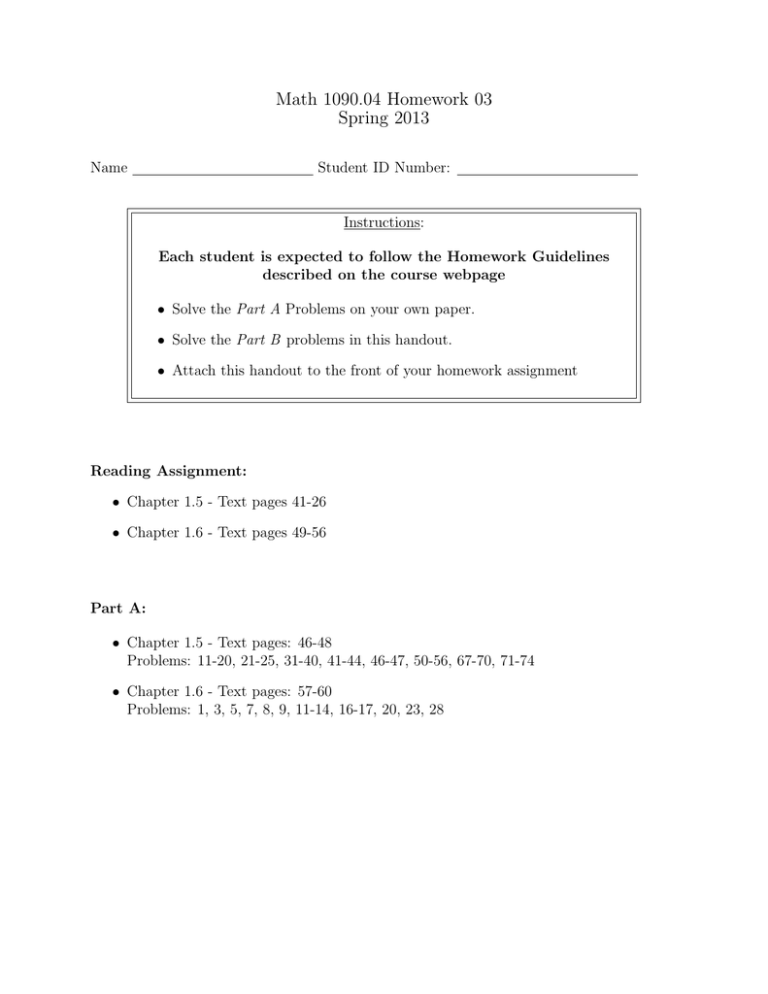
Math 1090.04 Homework 03 Spring 2013 Name Student ID Number: Instructions: Each student is expected to follow the Homework Guidelines described on the course webpage • Solve the Part A Problems on your own paper. • Solve the Part B problems in this handout. • Attach this handout to the front of your homework assignment Reading Assignment: • Chapter 1.5 - Text pages 41-26 • Chapter 1.6 - Text pages 49-56 Part A: • Chapter 1.5 - Text pages: 46-48 Problems: 11-20, 21-25, 31-40, 41-44, 46-47, 50-56, 67-70, 71-74 • Chapter 1.6 - Text pages: 57-60 Problems: 1, 3, 5, 7, 8, 9, 11-14, 16-17, 20, 23, 28 Math1090.004 Homework 03, Page 2 of 10 30 January 2013 DO NOT WRITE IN THIS TABLE!!! (It is for grading purposes.) Quantity of Completed Homework Problems: out of 89 Grade: Homework Quiz Review Questions: 1. Simplify the following expressions using the properties of exponents: 1 1 2 3 (a) (7x 3 )(2x 4 ) (b) (3x 3 )(4x 4 ) 1 (c) 20x 2 (d) 72x 4 1 5x 4 3 1 9x 3 2 (e) (x 3 )3 4 (f) (x 5 )5 1 (g) (25x4 y 6 ) 2 1 (h) (125x9 y 6 ) 3 Math1090.004 Homework 03, Page 3 of 10 30 January 2013 Chapter 1.5: Functions 2. Find the domain of the following function: g(x) = √ x2 − 5x − 14 3. Evaluate g(x) = x2 − 10x − 3 at the following values and simplify as much as possible: (a) g(−1) (b) g(2) (c) g(−3) (d) g(x + 2) Math1090.004 Homework 03, Page 4 of 10 30 January 2013 Chapter 1.6: Business Applications 4. Concert promoters are willing to sell tickets at a price of $8 each if they can sell 6040 tickets; however, if they can only sell 6250 tickets they insist on charging $50 each. At the same time, 7250 music fans are willing to purchase a ticket for $10 each, but only 7000 fans are willing to purchase a ticket if they are $20 each. (a) Find the Demand equation described by this scenario: (b) Find the Supply equation described by this scenario: Math1090.004 Homework 03, Page 5 of 10 30 January 2013 (c) Estimate the market equilibrium by graphing the supply and demand equations on the same graph. Figure 1: Problem 4 Record your estimate here: Math1090.004 Homework 03, Page 6 of 10 30 January 2013 (d) How many tickets can be sold and supplied for $40 per ticket. (e) Solve the system of equations to find the market equilibrium. (f) Is your estimate close to the actual answer? If not, can you explain why? Math1090.004 Homework 03, Page 7 of 10 30 January 2013 5. A gasoline station has weekly costs and revenue (the money taken in by the station) that are functions of the number of gallons of gasoline purchased and sold. If x gallons are purchased and sold, weekly costs are given by C(x) = 1.2x + 1080 and weekly revenue by R(x) = 1.6x (a) What are the fixed costs? What does this number tell you? (b) What are the variable costs? What does this number tell you? (c) What is the marginal profit? What does this number tell you? (d) What is the marginal revenue? What does this number tell you? (e) What is the profit from selling 100 items? How would you interpret this solution? Math1090.004 Homework 03, Page 8 of 10 30 January 2013 (f) What is the profit from selling 1000 items? Comparing this to (e), how would you interpret the answer? (g) Graph the appropriate equations to estimate the break even point (Hint: Convert decimals to fractions) Figure 2: Problem 5 Math1090.004 Homework 03, Page 9 of 10 30 January 2013 (h) Calculate the break-even point (i) How does your calculated break-even point compare to your estimate? If they are different, can you explain why? Math1090.004 Homework 03, Page 10 of 10 30 January 2013 6. Extra Credit Challenge: You drew a graph in the problem above to estimate the break even point - there is another graph you can draw to come up with the same estimate - What is it? If you figure it out: Include your graph and compare this estimate to your actual solution and your previous estimate. Figure 3: Problem 6
