May 10, 2001 MEMORANDUM FOR ASSISTANT SECRETARY OF THE ARMY (INSTALLATIONS
advertisement
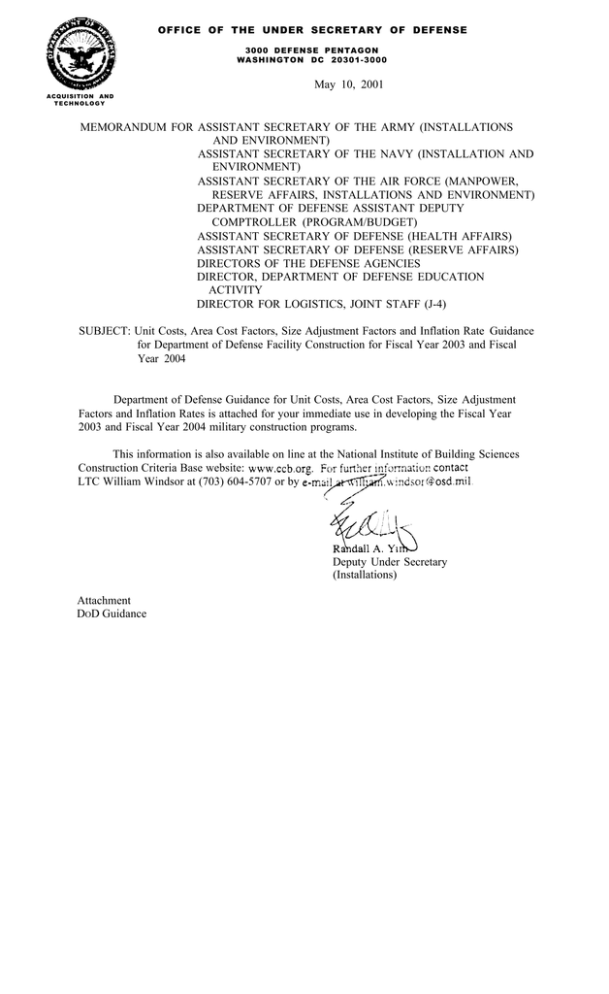
OFFICE OF THE UNDER SECRETARY OF DEFENSE 3000 DEFENSE PENTAGON WASHINGTON DC 20301-3000 May 10, 2001 ACQUISITION AND TECHNOLOGY MEMORANDUM FOR ASSISTANT SECRETARY OF THE ARMY (INSTALLATIONS AND ENVIRONMENT) ASSISTANT SECRETARY OF THE NAVY (INSTALLATION AND ENVIRONMENT) ASSISTANT SECRETARY OF THE AIR FORCE (MANPOWER, RESERVE AFFAIRS, INSTALLATIONS AND ENVIRONMENT) DEPARTMENT OF DEFENSE ASSISTANT DEPUTY COMPTROLLER (PROGRAM/BUDGET) ASSISTANT SECRETARY OF DEFENSE (HEALTH AFFAIRS) ASSISTANT SECRETARY OF DEFENSE (RESERVE AFFAIRS) DIRECTORS OF THE DEFENSE AGENCIES DIRECTOR, DEPARTMENT OF DEFENSE EDUCATION ACTIVITY DIRECTOR FOR LOGISTICS, JOINT STAFF (J-4) SUBJECT: Unit Costs, Area Cost Factors, Size Adjustment Factors and Inflation Rate Guidance for Department of Defense Facility Construction for Fiscal Year 2003 and Fiscal Year 2004 Department of Defense Guidance for Unit Costs, Area Cost Factors, Size Adjustment Factors and Inflation Rates is attached for your immediate use in developing the Fiscal Year 2003 and Fiscal Year 2004 military construction programs. This information is also available on line at the National Institute of Building Sciences Construction Criteria Base website: LTC William Windsor at (703) 604-5707 or by Deputy Under Secretary (Installations) Attachment DOD Guidance General Comments on Use of Unit Costs, Area Cost Factors, Size Adjustment Factor, and Inflation Rate February 1, 2001 The following tables for Unit Costs for DOD Facilities, Area Cost Factors (ACFs), Size Adjustment Factors. and OSD Inflation Rates are also maintained and available on the National Institute of Building Science Construction Criteria Database. Please address any questions regarding the following tables or cost engineering procedures to your participating Service member of the Tri-Service Committee on Cost Engineering. Air Force: Mr. Thomas Bums HQ AFCESA/CESC Tyndall Air Force Base, FL 32404-5319 (850) 283-6263 or DSN 523-6263 Internet: thomas.bums@tyndall.af.mil Army: Mr. Miguel Jumilla HQ USACE/CECW-EI Kingman Building, Room 321 7701 Telegraph Road Alexandria, VA 22315-3860 (703) 428-6976 or DSN 328-6976 Internet: miguel.d.jumilla@usace.army.mil Navy: Mr. Mohsen Athari NAVFACENGCOM-CHENG, Washington Navy Yard 1322 Patterson Ave., SE, Suite 1000 Washington, DC 20374-5065 (202) 685-9190 or DSN 325-9190 Internet. atharim@navfac.navy.mil Tables A1 and A2: Unit Costs for DOD Facilities: 2 1. Table Al provides metric unit cost data for DOD facilities in dollars per square meter ($/m ). Table A2 provides equivalent English unit cost data in dollars per square foot ($/SF). 2. Most of the unit costs and referenced facility sizes are based on historic construction award data for Air Force, Army and Navy projects with construction contracts awarded after January 1992. Unit costs for a few category codes that have a limited number of awarded projects are based on contracts awarded since 1989. The unit cost database includes only new construction projects and does not include data from renovation or add/alter projects. The facility types or category codes listed represent those facilities more frequently constructed by the Services. 3. The unit costs are escalated to October 2003 and October 2004, the assumed midpoints of construction for Fiscal Year (FY) 2003 and FY 04, respectively. Use the official OSD inflation rates shown in Table D to escalate the FY03 unit costs beyond FY03. 4. The unit costs are for primary facilities only and do not include supporting facility costs; equipment acquired with ocher fund sources: construction contingency factors; supervision, inspection, and overhead; or construction cost growth resulting from user changes, unforeseen site conditions, or contract document errors and omissions. Table B: Area Cost Factors: 1 Use these area cost factors (ACFs) only with the primary facility unit costs from Table A. 2. Area cost factors for some locations have been updated from a previous list based on the latest data input from the Services’ field offices. In general. the area cost factors are developed based on the construction market condition of local costs for a market basket of 8 labor crafts, 18 construction materials, and 4 equipment items. These labor, materials, and equipment (LME) items are representative of the types of products and services used to construct most military facilities. In 1998, the last market survey covered a list of 222 locations that included 96 Base Cities (two per state in the Continental United States), 106 additional locations in the United Stares and 20 overseas locations. A new construction market survey will be conducted in 2002. 3. Each of the LME costs is normalized and weighted to represent its contribution to the total cost of a typical facility. The normalized LME then is modified by seven matrix factors that cover local conditions affecting construction costs, These matrix factors include weather, seismic, climatic (frost zone, wind loads, and heating, ventilating and air conditioning, labor availability, contractor overhead and profit, life support and mobilization, and labor productivity versus the U.S. standard, The resultant ACF for each location is normalized again by dividing by the Base City average to obtain a final ACF chat reflects the relative relationship of construction costs between that location and the Base City average as 1.00. 4. There is no easy correlation between these ACFs and previous ACFs for specific locations. No common benchmarks exist because both the Base City average and the relationships between cities change for each two-year cycle. It is possible, however, to compare differences between several locations in this database with differences between the same locations in previous databases. 5. Do not use these ACFs to modify parametric cost estimates, detailed quantity-take-offs. unit price book line items, or commercial cost data. These other cost estimating systems and databases have their own processes and factors for adjusting costs to different locations. 2 1. The Size Adjustment Factors table is based on data analysis that shows a correlation exists between project size and construction cost. Unit construction costs generally are lower for larger projects due to greater opportunities for material quantity discounts and for spreading mobilization. demobilization and general overhead costs over a greater number of units. 2. All unit costs are based on the referenced facility sizes. Use Table C, Size Adjustment Factor, to adjust unit costs for facilities whenever your project size differs from the referenced facility size shown in Table Al or A2. Divide the gross area of your proposed facility by the referenced size for that facility type to determine the size relationship ratio. Use this ratio to find the appropriate size adjustment factor in Table C. Multiply the unit cost from Table Al or A2 by the size adjustment factor to calculate the adjusted unit cost for your facility. if applicable. 3 Base your proposed project size on the total project scope co be awarded as a single construction contract, regardless of the number of buildings to be constructed within that scope If a construction award project is to be broken into a number of discreet phases where the contractor has limited control over the phasing, use the average scope for all phases as the basis for your size adjustment calculations, 2 4. EXAMPLE: You propose to build a 6,440 m Enlisted Dormitory (Barracks) in FY03. The 2 referenced facility size taken from the unit cost summary is 9,200 m . The size relationship 2 2 quotient IS 0.70 (6,440 m divided by 9,250 m ). Enter Table C to find the Size Adjustment 2 Factor of 1.04. Multiply the unit cost of $ 1,539/m by .04 to determine that your adjusted unit 2 cost is $1,600/m . Table D: Inflation Rates: 1. The inflation rates in Table D are based on guidance issued by the Office of the Under Secretary of Defense (Comptroller) (OUSD(C)) memorandum of January 30, 2000. Use these rates in submission of the President’s Budgets for FY03 and FY04 and in supporting Congressional justification materials unless OUSD(C) modifies the rates. The inflation rates are subject to change during the course of the budget review. 2. The Table D inflation guidance has an arbitrary baseline of 1.00 for October 2002. The inflation indices are based on the Engineering News Record historic data through October 1999 and the Comptroller-projected inflation rates after that date. 3 TABLE A1 PRIMARY FACILITY UNIT COST DATA FOR DOD FACILITIES - METRIC UNITS February 1, 2001 TABLE A1 PRIMARY FACILITY UNIT COST DATA FOR DOD FACILITIES METRIC UNITS February 1, 2001 l Page 2 TABLE A1 PRIMARY FACILITY UNIT COST DATA FOR DOD FACILITIES - METRIC UNITS February 1, 2001 Page 3 TABLE A2 PRIMARY FACILITY UNIT COST DATA FOR DOD FACILITIES - ENGLISH UNITS February 1, 2001 Page 1 TABLE A2 PRIMARY FACILITY UNIT COST DATA FOR DOD FACILITIES - ENGLISH UNITS February 1, 2001 Page 2 TABLE A2 PRIMARY FACILITY UNIT COST DATA FOR DOD FACILITIES. ENGLISH UNITS February 1, 2001 Page3 TABLE B AREA COST FACTOR INDICES February 1, 2001 PART 1 - U.S. LOCATIONS STATE LOCATION ACF INDEX MOBILE MONTGOMERY ANNISTON ARMY DEPOT iA) (A) FORT MCCLELLAN (A) FORT RUCKER (AF) MAXWELL AIR FORCE BASE (N) MOBILE AREA (A) REDSTONE ARSENAL 0.85 0.84 0.86 0.84 0.84 0.81 0.86 0.84 0.86 ANCHORAGE FAIRBANKS (N) ADAK NAVAL STATION (AF) CLEAR AIR FORCE BASE (AF) EIELSON AIR FORCE BASE (AF) ELMENDORF AIR FORCE BASE (A) FORT GREELY (A) FORT RICHARDSON (A) FORT WAINWRIGHT (AF) SHEMYA AIR FORCE BASE 1.84 1.68 2.01 3.41 2.13 2.03 1.59 2.15 1.59 2.01 3.45 FLAGSTAFF TUSCON (AF) DAVIS MONTHAN AIR FORCE BASE (A) FORT HUACHUCA (AF) LUKE AIR FORCE BASE (A) NAVAJO ARMY DEPOT (N) YUMA MCAS (A) YUMA PROVING GROUND 0.98 0.98 0.98 1.01 1.00 0.98 0.96 1.16 1.12 FORT SMITH PINE BLUFF (A) FORT CHAFFEE (AF) LITTLE ROCK AIR FORCE BASE (A) PINE BLUFF ARSENAL 0.87 0.85 0.89 0.84 0.83 0.89 ALABAMA ALASKA ARIZONA ARKANSAS TABLE B AREA COST FACTOR INDICES February 1, 2001 PART I - U.S. LOCATIONS STATE ACF INDEX LOCATION CALIFORNIA 1.20 1.20 1.20 1.35 (AF) SAN DIEGO SAN FRANCISCO 29 PALMS MARINE CORPS BASE BEALE AIR FORCE BASE CAMP PENDLETON MARINE CORPS CENTERVILLE BEACH CHINA LAKE NAVAL WEAPONS CENTER EDWARDS AIR FORCE BASE EL CENTRO NAVAL AIR FIELD FORT HUNTER LIGGETT FORT IRWIN FORT ORD LEMOORE NAVAL AIR STATION LOS ANGELES AREA MARCH AIR FORCE BASE MCCLELLAN AIR FORCE BASE MONTEREY AREA OAKLAND ARMY BASE PORT HUENEME AREA RIVERBANK ARMY AMMO PLANT SACRAMENTO ARMY DEPOT SAN CLEMENTE ISLAND SHARPE ARMY DEPOT SIERRA ARMY DEPOT STOCKTON AREA TRAVIS AIR FORCE BASE VANDENBERG AIR FORCE BASE 1.19 1.10 1.30 1.26 1.24 1.25 1.26 1.17 1.25 1.12 1.05 1.06 1.17 1.20 1.12 1.14 1.06 1.91 1.17 1.27 1.15 1.24 1.20 (AF) (AF) (A) (A) (AF) (A) (A) (AF) COLORADO SPRINGS DENVER AIR FORCE ACADEMY CHEYENNE MOUNTAIN FITZSIMMONS ARMY MED CENTER FORT CARSON PETERSON AIR FORCE BASE PUEBLO ARMY DEPOT ROCKY MOUNTAIN ARSENAL SCHRIEVER AIR FORCE STATION 1.03 1.03 1.03 1.03 1.17 1.04 1.06 1.06 0.95 1.01 1.17 (N) (A) BRIDGEPORT NEW LONDON NEW LONDON AREA STRATFORD ENGINE PLANT 1.08 1.05 1.11 1.12 1.05 (N) (AF) (N) (N) (N) (AF) (N) (A) (A) (A0 (N) (N) (AF) (AF) (N) (A) (A) (A) (N) (A) (A) (N) COLORADO CONNECTICUT 2 1.22 TABLE B AREA COST FACTOR INDICES February 1, 2001 PART I - U.S. LOCATIONS STATE ACF INDEX LOCATION DOVER WILMINGTON (AF) DOVER AIR FORCE BASE 0.99 1.01 0.97 1.01 MIAMI PANAMA CITY (AF) CAPE CANAVERAL (AF) EGLIN AIR FORCE BASE (AF) HOMESTEAD AIR FORCE BASE (N) JACKSONVILLE AREA (N) KEY WEST NAVAL AIR STATION (AF) MACDILL AIR FORCE BASE (N) ORLANDO AREA (N) PANAMA CITY AREA (N) PENSACOLA AREA (AF TYNDALL AIR FORCE BASE 0.87 0.91 0.82 0.98 0.82 0.91 0.93 1.10 0.88 0.84 0.82 0.84 0.82 ALBANY ATLANTA (N) ALBANY AREA (A) FORT BENNING (A) FORT GILLEM (A) FORT GORDON (A) FORT MCPHERSON (A) FORT STEWART (N) KINGS BAY NAVAL SUBMARINE BASE (AF) MOODY AFB (AF) ROBINS AFB 0.85 0.79 0.91 0.79 0.80 0.91 0.84 0.91 0.82 0.99 0.83 0.80 DELAWARE FLORIDA GEORGIA HAWAlI HONOLULU KANEOHE BAY (N) BARBERS POINT NAVAL AIR STA (N) BARKING SANDS (N) FORD ISLAND (A) FORT DERUSSY (A) FORT SHAFTER (AF) HICKAM AIR FORCE BASE (N) KANEOHE MARINE CORPS AIR ST (N) PEARL HARBOR (N) POHAKULOA (A) SCHOFIELD BARRACKS (A) TRIPLER ARMY MEDICAL CENTER (A) WHEELER ARMY AIR FIELD 3 1.57 1.49 1.64 1.64 1.64 1.57 1.45 1.47 1.45 1.64 1.57 1.80 1.56 1.58 1.56 TABLE B AREA COST FACTOR INDICES February 1, 2001 PART I - U.S. LOCATIONS STATE LOCATION IDAHO ACF INDEX 1.06 BOISE MOUNTAIN HOME (AF) MOUNTAIN HOME AIR FORCE BASE 1.01 1.11 1.11 BELLEVILLE CHICAGO (N) FOREST PARK (CHICAGO) (N) GLENVIEW (CHICAGO) (N) GREAT LAKES (NTC) (A) ROCK ISLAND ARSENAL (A) SAVANNAH ARMY DEPOT (AF) SCOTT AIR FORCE BASE 1.15 1.09 1.22 1.22 1.22 1.26 1.06 1.02 1.20 INDlANAPOLIS LOGANSPORT (N) CRANE NWSC (A) FORT BENJAMIN HARRISON (AF) GRISSOM AIR FORCE BASE (A) JEFFERSON PROVING GROUND 0.99 1.01 0.96 1.06 1.04 1.10 0.93 BURLINGTON DES MOINES IOWA ARMY AMMO PLANT 1.06 1.11 1.00 1.19 MANHATTAN WICHITA (A) FORT LEAVENWORTH (A) FORT RILEY (A) KANSAS ARMY AMMO PLANT (AF) MCCONNELL AIR FORCE BASE 0.93 0.96 0.91 1.05 1.09 0.97 0.91 ILLINOIS INDIANA IOWA (A) KANSAS KENTUCKY (A) (A) (A) (N) 0.94 LEXINGTON 0.91 LOUISVILLE 0.97 1.06 FORT CAMPBELL 1.05 FORT KNOX LEXINGTON/BLUE GRASS ARMY DEPOT 0.98 0.97 LOUISVILLE NAVAL AIR STATION TABLE B AREA COST FACTOR INDICES February 1, 2001 PART I - U.S. LOCATIONS STATE ACF INDEX LOCATION LOUISIANA NEW ORLEANS SHREVEPORT (AF) BARKSDALE AIR FORCE BASE (A) FORT POLK (A) LOUISIANA ARMY AMMO PLANT (A) NEW ORLEANS ARMY BASE 0.89 0.95 0.84 0.86 0.89 0.82 0.95 BANGOR PORTLAND (N) BRUNSWICK AREA (N) CUTLER WINTER HARBOR 1.06 1.07 1.05 1.02 1.02 BALTIMORE LEXINGTON PARK (A) ABERDEEN PROVING GROUND (AF) ANDREWS AIR FORCE BASE (N) ANNAPOLIS (N) BETHESDA (N) CHELTONHAM (DC) (N) CHESAPEAKE BEACH (A) FORT DETRICK (A) FORT GEORGE G MEADE (A) FORT RITCHIE (A) HARRY DIAMOND LAB (N) INDIAN HEAD (N) PATUXENT RIVER AREA (N) THURMONT 0.99 0.90 1.08 0.90 0.96 0.90 0.96 0.96 0.90 0.88 0.90 0.88 0.96 0.96 1.08 0.88 BOSTON FITCHBURG (A) ARMY MATERIAL & MECHANICAL LAB (A) FORT DEVENS (AF) HANSCOM AIR FORCE BASE 1.12 1.16 1.08 1.14 1.16 1.12 DETROIT MARQUETTE (A) DETROIT ARSENAL (AF K I SAWYER AIR FORCE BASE 1.17 1.19 1.15 1.19 1.16 MAINE MARYLAND MASSACHUSETTS MICHIGAN MINNESOTA 1.07 1.10 1.04 DULUTH MINNEAPOLIS 5 TABLE B AREA COST FACTOR INDICES February 1, 2001 PART I - U.S. LOCATIONS LOCATlON ACF INDEX (AF) (N) (AF) (N) BILOXI COLUMBUS COLUMBUS AIR FORCE BASE GULFPORT AREA KEESLER AIR FORCE BASE MERIDIAN NAVAL AIR STATION 0.87 0.92 0.81 0.81 0.92 0.92 0.95 (A) (A) (A) (AF) KANSAS CITY SEDALIA FORT LEONARD WOOD LAKE CITY ARMY PLANT ST LOUIS ARMY AMMO PLANT WHITEMAN AIR FORCE BASE 0.97 1.01 0.93 1.10 1.08 1.05 1.01 (AF) BILLINGS GREAT FALLS MALMSTROM AIR FORCE BASE 1.14 1.17 1.12 1.16 -STATE -MISSISSIPPI MISSOURI MONTANA NEBRASKA GRAND ISLAND OMAHA (A) CORNHUSKER ARMY AMMO PLANT (AF) OFFUTT AIR FORCE BASE NEVADA 0.93 0.89 0.98 0.89 1.01 HAWTHORNE LAS VEGAS FALLON NAVAL AIR STATION HAWTHORNE ARMY AMMO PLANT NELLIS AIR FORCE BASE 1.14 1.16 1.12 1.20 1.16 1.17 (N) CONCORD PORTSMOUTH PORTSMOUTH AREA 1.05 1.06 1.04 1.04 (N) (N) (A) (A) (AF) (A) NEWARK TRENTON BAYONNE MILITARY OCEAN TERMINAL EARLE/COLTS NECK FORT DIX FORT MONMOUTH MCGUIRE AIR FORCE BASE PICATINNY ARSENAL 1.18 1.19 1.17 1.18 1.22 1.17 1.17 1.17 1.24 (N) (A) (AF) NEW HAMPSHIRE NEW JERSEY 6 TABLE B AREA COST FACTOR INDICES February 1, 2001 PART I - U.S. LOCATIONS STATE ACF INDEX LOCATION NEW MEXICO ALAMOGORDO ALBUQUERQUE (AF) CANNON AIR FORCE BASE (AF) HOLLOMAN AIR FORCE BASE (AF) KIRTLAND AIR FORCE BASE (A) WHITE SANDS MISSLE RANGE 0.99 0.98 0.99 1.04 0.98 0.99 1.03 ALBANY BUFFALO (A) FORT DRUM (AF) GRIFFISS AIR FORCE BASE (A) NEW YORK CITY (N) NIAGARA (AF) PLATTSBURGH AIR FORCE BASE (A) SENECA ARMY DEPOT (N) STATEN ISLAND (A) U. S. MILITARY ACADEMY (A) WATEAVLIET ARSENAL 1.11 1.05 1.18 1.16 1.02 1.41 1.18 1.04 1.09 1.35 1.28 0.99 FAYETTEVILLE GREENSBORO (N) CAMP LEJEUNE AREA (N) CHERRY POINT (A) FORT BRAGG (N) NEW RIVER (AF) POPE AIR FORCE BASE (AF) SEYMOUR JOHNSON AIR FORCE BASE (A) SUNNY POINT 0.85 0.85 0.85 0.94 0.94 0.88 0.94 0.88 0.82 0.91 GRAND FORKS MINOT (AF) MINOT AIR FORCE BASE 1.04 1.01 1.08 1.11 DAYTON YOUNGSTOWN (A) RAVENNA ARMY AMMO PLANT (AF) WRIGHT-PATTERSON AIR FORCE BASE 0.99 0.97 1.01 1.00 0.97 NEW YORK NORTH CAROLINA NORTH DAKOTA OHIO 7 TABLE B AREA COST FACTOR INDICES February 1, 2001 PART I - U.S. LOCATIONS STATE LOCATION OKLAHOMA LAWTON OKLAHOMA CITY (AF) ALTUS AIR FORCE BASE (A) FORT SILL (A) MCALESTER ARMY AMMO PLANT (AF) TlNKER AIR FORCE BASE (AF) VANCE AIR FORCE BASE OREGON (A) PENDLETON PORTLAND UMATlLlA ARMY DEPOT PENNSYLVANIA (A) (A) (A) (N) (A) (N) (A) (N) PHILADELPHIA PITTSBURGH CARLISLE BARRACKS FORT INDIANTOWN GAP LETTERKENNY ARMY DEPOT MECHANISBURG AREA NEW CUMBERLAND ARMY DEPOT PHILADELPHIA AREA TOBYHANNA ARMY DEPOT WARMINSTER RHODE ISLAND NEWPORT PROVIDENCE SOUTH CAROLINA ACF INDEX 0.87 0.87 0.86 0.96 0.91 0.84 0.86 0.91 1.10 1.12 1.08 1.25 1.03 1.08 0.98 0.94 1.00 1.00 0.94 0.94 1.08 1.06 1.06 1.06 1.09 1.03 CHARLESTON COLUMBIA (N) BEAUFORT AREA (AF) CHARLESTON AIR FORCE BASE (A) FORT JACKSON (AF) SHAW AIR FORCE BASE 0.87 0.89 0.85 1.04 0.89 0.85 0.86 RAPID CITY SIOUX FALLS (AF) ELLSWORTH AIR FORCE BASE 0.93 0.91 0.96 0.91 CHATTANOOGA MEMPHIS (AF) ARNOLD AIR FORCE STATION (N) MEMPHIS NAVAL AIR STATION 0.87 0.83 0.91 0.87 1.00 SOUTH DAKOTA TENNESSEE TABLE B AREA COST FACTOR INDICES February 1, 2001 PART I - U.S. LOCATIONS STATE LOCATION ACF INDEX TENNESSEE (Cont) (A) VOLUNTEER ORDINANCE WORKS 0.80 TEXAS SAN ANGELO SAN ANTONIO (AF) BROOKS AIR FORCE BASE (A) CAMP BULLIS (N) CORPUS CHRISTI AREA (N) DALLAS (AF) DYESS AIR FORCE BASE (A) FORT BLISS (A) FORT HOOD (A) FORT SAM HOUSTON (AF) GOODFELLOW AIR FORCE BASE (N) INGLESIDE NAVAL AIR STATION (AF) KELLY AIR FORCE EASE (N) KINGSVILLE AREA (AF) LACKLAND AIR FORCE BASE (AF) LAUGHLIN AIR FORCE BASE (A) LONE STAR ARMY AMMO PLANT (A) LONGHORN ARMY AMMO DEPOT (AF) RANDOLPH AIR FORCE BASE (A) RED RIVER ARMY DEPOT (AF) REESE AIR FORCE BASE (AF) SHEPPARD AIR FORCE BASE 0.82 0.81 0.82 0.82 0.82 0.90 0.89 0.98 0.91 0.86 0.82 0.81 0.94 0.82 0.91 0.82 0.89 0.89 0.80 0.82 0.89 0.90 0.95 OGDEN SALT LAKE CITY (A) DUGWAY PROVING GROUND (A) FORT DOUGLAS (AF) HILL AIR FORCE BASE (A) TOOELE ARMY DEPOT 1.03 1.04 1.03 1.06 1.03 1.05 1.06 UTAH VERMONT BURLINTTON MONTPELIER 0.92 0.91 0.93 NORFOLK RICHMOND DAHLGREN FORT A P HILL FORT BELVOIR FORT EUSTIS FORT LEE FORT MONROE FORT MYER FORT PICKETT 0.92 0.92 0.92 0.91 0.87 0.95 0.92 0.94 0.92 0.95 0.94 VIRGINIA (A) (A) (A) (A) (A) (A) (A) 9 TABLE B AREA COST FACTOR INDICES February 1, 2001 PART I - U.S. LOCATIONS STATE ACF INDEX LOCATION 0.92 VIRGINIA (Cont) (A) FORT STORY (AF) LANGLEY AIR FORCE BASE (N) QUANTICO MARINE BASE (A) REDFORD ARMY AMMO PLANT (A) VlNT HILL FARMS (N) WALLOPS ISLAND 0.92 0.92 0.94 0.95 0.91 1.12 SPOKANE TACOMA (N) BREMERTON (N) EVERETT (AF) FAIRCHILD AIR FORCE BASE (A) FORT LEWIS (N) INDIAN HEAD (AF) MCCHORD AIR FORCE BASE (N) SILVERDALE (N) WHIDBEY ISLAND NAVAL AIR STATION (A) YAKIMA FIRING RANGE 1.07 1.06 1.09 1.16 1.11 1.06 1.09 1.16 1.09 1.14 1.27 1.08 BLUEFIELD CHARLESTON (N) SUGAR GROVE 0.95 0.94 0.97 1.43 MADISON MILWAUKEE (A) BADGER ARMY AMMO PLANT (A) FORT MCCOY 1.14 1.15 1.13 1.22 1.19 CASPER CHEYENNE (AF) F E WARREN AIR FORCE BASE 0.99 0.98 1.01 1.04 WASHINGTON WEST VIRGINIA WISCONSIN WYOMING WASHINGTON DC 0.96 0.96 (AF) BOLLING AIR FORCE BASE 0.96 (A) FORT MCNAIR (A) WALTER REED ARMY MEDICAL CENTER 0.96 10 TABLE B AREA COST FACTOR INDICES February 1, 2001 PART II - OCONUS LOCATIONS ACF INDEX CURRENCY EXCHANGE REMARKS 1.96 2.70 ANTIGUA $/US $ 1.32 1.55 1.18 1.15 1.40 1.76 AUSTRALIAN $/US $ DARWIN PERTH SYDNEY WOOMERA AS 1.28 1.28 212.6 PORTUGUESE ESCUDO/US $ LAJES 1.70 1.70 1.00 BAHAMIAN $/US $ ANDROS ISLAND 1.31 0.377 BAHRAIN DINAR/US $ 1.33 1.33 1.19 EURO/US $ 1.59 1.00 BERMUDA $/US 1.34 ARGENTIA/NEWFOUNDLAND 1.34 1.49 CANADIAN $/US $ 1.31 1.31 1.00 US $ DIEGO GARCIA 2.52 1.00 US$ EGYPT 1.31 1.31 3.83 EGYPTIAN POUND/US $ xxx 1.19 EURO/SU$ 1.24 1.21 1.24 1.24 1.27 1.19 EURO/US $ FRANKFURT KAISERSLAUTERN TRIER SPANGDALHEM 1.23 1.23 361.4 DRACHMA/US $ ATHENS 2.92 2.92 7.87 DANISH KRONE/US $ GODHAAB (WUUK) NATIONS LOCATIONN ANTIGUA AUSTRALIA AZORES BAHAMAS BAHRAIN BELGIUM BRUSSELS BERMUDA CANADA CUBA GUANTANAMO CAIRO EUROPEAN COMMUNITY GERMANY GREECE GREENLAND TABLE B AREA COST FACTOR INDICES Februay 1, 2001 PART II - OCONUS LOCATIONS NATION LOCATION CURRENCY ACF INDEX EXCHANGE REMARKS GUAM 2.03 1.00 US $ ICELAND 2.59 2.59 84.36 KRONA/US $ ISRAEL 1.34 4.079 NEW SHEKEL/US $ ITALY 1.19 EURO/US $ AVlANO ISOLA DI CAP0 RIZZUTO LA MADDALENA NAPLES SIGONELLA 1.24 1.32 1.23 1.28 1.20 1.16 111.26 YEN/US $ ATSUGI IWAKUNI MISAWA OKINAWA TOKYO 1.92 1.94 1.85 1.98 1.90 1.94 JOHNSTON ATOLL 2.26 1.00 US $ KOREA 1.13 1.13 1.09 1.25 1.13 1.12 1.13 1.12 1.12 1.08 1.12 1.12 1.12 1,189.50 WON/US $ KUWAIT 1.24 0.31 DINAR/US $ KWAJALEIN 2.33 1.00 US $ MIDWAY ISLAND 2.21 1.00 US $ MOROCCO 10.57 DIRHAM/US $ CASABLANCA 1.08 1.08 1.19 EURO/US $ OSS 1.30 1.30 REYKJAVIK JAPAN CHINHAE CHUNCHON DMZ ZONE AREA KUNSAN OSAN POHANG PUSAN PYONGTAEK SEOUL TAEGU TONGDUCHON WONJU NETHERLANDS 12 TABLE B AREA COST FACTOR INDICES Februay 1, 2001 PART II - OCONUS LOCATIONS LOCATION ACF INDEX CURRENCY EXCHANGE REMARKS 1.77 1.77 2.21 NEW ZEALAND $/US $ WELLINGTON 1.18 1.18 0.385 RlLOMANI/US $ RUWl 1.21 1.21 1.00 US $ PANAMA CITY 0.60 0.59 0.61 55.25 PHILIPPINE PESO/US $ MANILA SUBIC BAY 1.38 1.38 1.38 1.00 US $ ROOSEVELT ROAD SAN JUAN QATAR 1.25 3.64 RIYAL/US $ SEYCHELLES ISLAND 1.92 1.00 US $ 1.20 1.20 1.19 EURO/US $ 1.13 42.67 BAHT/US $ 0.91 0.92 0.90 692,030 TURKEY LIRA/US $ 0.71 BRITISH POND/US $ NATION NEW ZEALAND OMAN PANAMA PHILIPPINES PUERTO RICO SPAIN ROTA THAILAND TURKEY ANKARA INCIRLIK UNITED KINGDOM 1.25 LONDON 1.32 MANCHESTER (MILDENHALL) 1.21 ST MAWGAN (LAKENHEATH) 1.21 EDZELL, SCOTLAND 1.25 13 TABLE C SIZE ADJUSTMENT FACTORS (ALL FACILITIES OTHER THAN MILITARY FAMILY HOUSING) TABLE D OSD INFLATION INDICES (OMB Rates for Projecting Future Escalation) (Baselined to October 2002 as 1.000) February 22, 2000 Inflation multipliers through October 1999 are based on Engineering News Record Building Construction Indices. Inflation multipliers after October 1999 are projections based on guidelines issued by the Off ice of the Under Secretary of Defense (Comptroller) memorandum of 30 June 2000. Use these inflation indices to adjust unit costs for projects FY 2003 and beyond unless OUSD(C) modifies the rate. The inflation rates are subject to change during the course of the budget.

