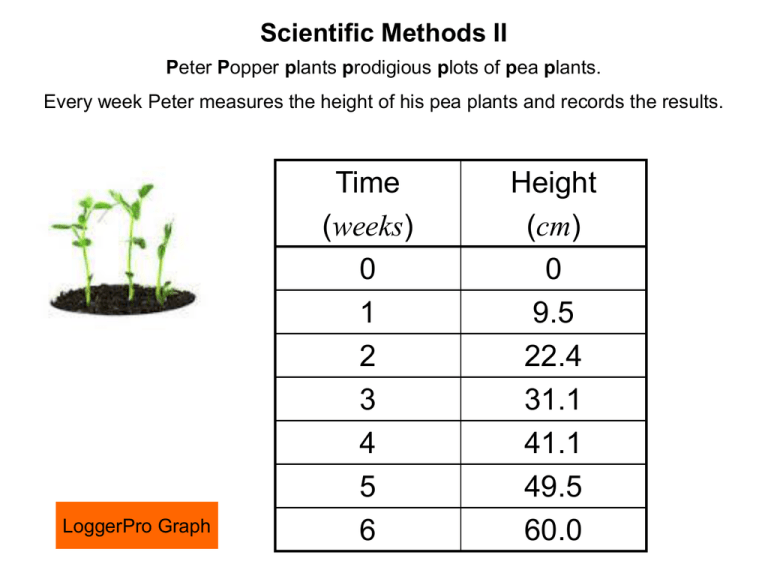
Time Height weeks cm
advertisement

Scientific Methods II Peter Popper plants prodigious plots of pea plants. Every week Peter measures the height of his pea plants and records the results. LoggerPro Graph Time (weeks) 0 1 2 3 4 5 6 Height (cm) 0 9.5 22.4 31.1 41.1 49.5 60.0 Scientific Methods II Peter Popper plants prodigious plots of pea plants. Every week Peter measures the height of his pea plants and records the results. Since the graph is linear and contains (0,0), H t The height is proportional to the time y m x b cm 954cm H 99..954 week Every week the pea plant grows on average 9.954 cm. Scientific Methods II Peter Popper plants prodigious plots of pea plants. Every week Peter measures the height of his pea plants and records the results. Since the graph is linear and contains (0,0), H t y m H 9.954 cm x b t week Scientific Methods II Peter Popper plants prodigious plots of pea plants. Every week Peter measures the height of his pea plants and records the results. To determine whether or not the yintercept is significant: Since the graph is linear and contains (0,0), 1. Test of logic y H t m x b H 9.954 cm What does it mean if there is a (0,0) point on the graph? At 0 weeks the height of the pea plant is 0 cm. week t Scientific Methods II Peter Popper plants prodigious plots of pea plants. Every week Peter measures the height of his pea plants and records the results. To determine whether or not the yintercept is significant: Since the graph is linear and contains (0,0), 1. Test of logic 2. 5 % Rule – If the y-intercept is less then 5 % of the maximum y -value, it can be considered negligible. Maximum height (y-value) = 60 cm 5% 0f 60 cm = 0.05 x 60 cm = 3.0 cm 3.0 cm > 0.6538 cm Since the y-intercept is less than 5% of the maximum y-value, it is negligible. y H t m x b H 9.954 cm week t


