of arsenic and antimony biogeochemical behavior in water, Comparison
advertisement
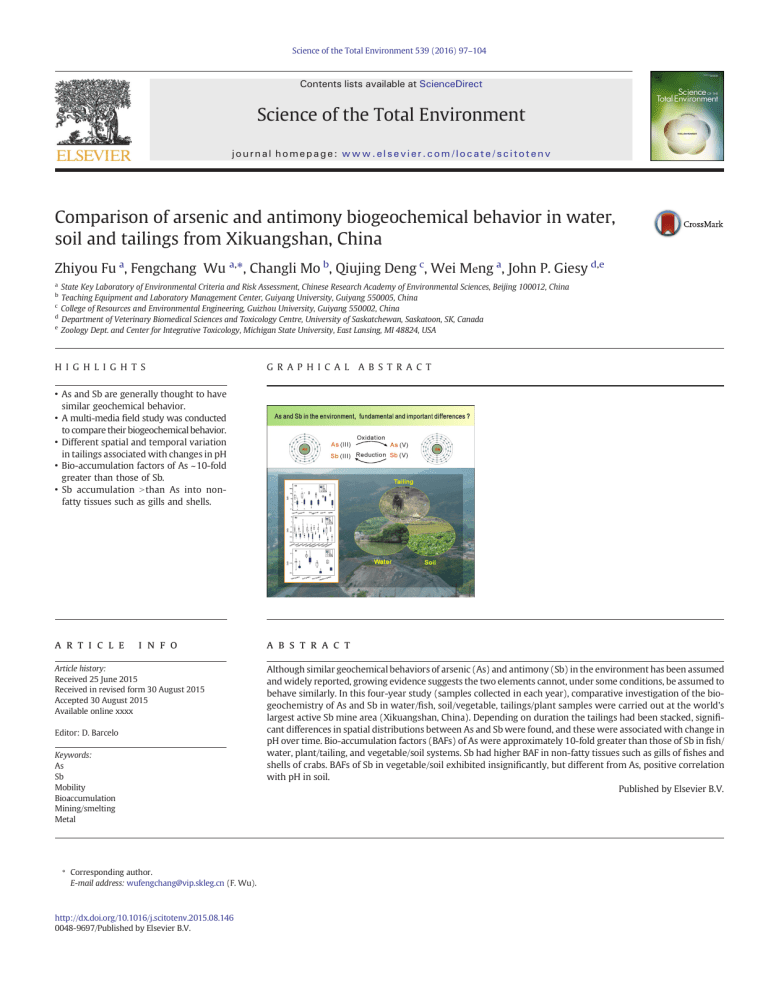
Science of the Total Environment 539 (2016) 97–104 Contents lists available at ScienceDirect Science of the Total Environment journal homepage: www.elsevier.com/locate/scitotenv Comparison of arsenic and antimony biogeochemical behavior in water, soil and tailings from Xikuangshan, China Zhiyou Fu a, Fengchang Wu a,⁎, Changli Mo b, Qiujing Deng c, Wei Meng a, John P. Giesy d,e a State Key Laboratory of Environmental Criteria and Risk Assessment, Chinese Research Academy of Environmental Sciences, Beijing 100012, China Teaching Equipment and Laboratory Management Center, Guiyang University, Guiyang 550005, China c College of Resources and Environmental Engineering, Guizhou University, Guiyang 550002, China d Department of Veterinary Biomedical Sciences and Toxicology Centre, University of Saskatchewan, Saskatoon, SK, Canada e Zoology Dept. and Center for Integrative Toxicology, Michigan State University, East Lansing, MI 48824, USA b H I G H L I G H T S G R A P H I C A L A B S T R A C T • As and Sb are generally thought to have similar geochemical behavior. • A multi-media field study was conducted to compare their biogeochemical behavior. • Different spatial and temporal variation in tailings associated with changes in pH • Bio-accumulation factors of As ~10-fold greater than those of Sb. • Sb accumulation N than As into nonfatty tissues such as gills and shells. a r t i c l e i n f o Article history: Received 25 June 2015 Received in revised form 30 August 2015 Accepted 30 August 2015 Available online xxxx Editor: D. Barcelo Keywords: As Sb Mobility Bioaccumulation Mining/smelting Metal ⁎ Corresponding author. E-mail address: wufengchang@vip.skleg.cn (F. Wu). http://dx.doi.org/10.1016/j.scitotenv.2015.08.146 0048-9697/Published by Elsevier B.V. a b s t r a c t Although similar geochemical behaviors of arsenic (As) and antimony (Sb) in the environment has been assumed and widely reported, growing evidence suggests the two elements cannot, under some conditions, be assumed to behave similarly. In this four-year study (samples collected in each year), comparative investigation of the biogeochemistry of As and Sb in water/fish, soil/vegetable, tailings/plant samples were carried out at the world's largest active Sb mine area (Xikuangshan, China). Depending on duration the tailings had been stacked, significant differences in spatial distributions between As and Sb were found, and these were associated with change in pH over time. Bio-accumulation factors (BAFs) of As were approximately 10-fold greater than those of Sb in fish/ water, plant/tailing, and vegetable/soil systems. Sb had higher BAF in non-fatty tissues such as gills of fishes and shells of crabs. BAFs of Sb in vegetable/soil exhibited insignificantly, but different from As, positive correlation with pH in soil. Published by Elsevier B.V. 98 Z. Fu et al. / Science of the Total Environment 539 (2016) 97–104 1. Introduction Both arsenic (As) and antimony (Sb) have been listed as priority pollutants of interest by both the United States and European Union (EU, 1976; USEPA, 1979). Potential toxicity and risks to health of humans prompted concerns over their biogeochemical behaviors (Abernathy et al., 1999; Ahmed et al., 2006; Amarasiriwardena and Wu, 2011; Filella et al., 2002; Gebel, 1999; Shotyk et al., 2005). Arsenic is mainly associated with Sb as a sulfide or oxide (Hale, 1981; Hawkes and Webb, 1962; Li and Thornton, 1993). Arsenic has attracted wide attention due to its natural presence in high concentrations in some areas such as in Bangladesh and West Bengal (Chowdhury et al., 2000; Frisbie et al., 2002). In contrast, the relative abundance of Sb in most matrices is generally small (e.g., less than 1 mg/kg in chondrite, basic rocks, carbonates, less than 10 mg/kg in soils, and less than 1 μg/L in unpolluted water) (Filella et al., 2002; Smith and Huyck, 1999). However, world annual production of Sb is approximately 4-fold greater than that of As. Antimony is used in batteries, flame retardants, paints, semiconductors, low friction metals, paints, ceramics, and other things. The annual output of Sb from mines in the past 20 years was 127,800 tonnes compared to 47,020 tonnes for As (USGS, 1995-2013). Pollution with Sb is getting worse in certain cities. For instance, the concentration of Sb in particles in the atmosphere of Tokyo, Japan is at least 2-fold greater than that of As (Zheng et al., 2000). Both As and Sb are group V elements, and have been assumed to have comparable geochemical behavior and toxicity. Tremendous effort has been devoted to understanding the biogeochemical behavior of As (Abernathy et al., 1999; Dixit and Hering, 2003; Seyfferth et al., 2010), whereas research specific to Sb is limited. Due to the absence of sufficient experimental data for Sb, it has been common practice to extend the observed behavior of As (uptake, tolerance mechanisms, methylation) to Sb on the basis of the chemical similarities that exist between the two elements (Filella et al., 2007). However, As and Sb have different coordination (e.g., their different atomic size), which would result in different biogeochemical behavior. In fact, growing evidence also suggested the two metalloids cannot, under some conditions, be assumed to behave similarly (Leuz et al., 2006b; Tschan et al., 2009; Wilson et al., 2010). This is a challenge for interpreting behaviors of Sb based on behavior of As. For instance, Sb was predominantly present as Sb(V), while As was present as a mixture of As(III) and As(V) in the water (Ritchie et al., 2013) and soil–water system (Mitsunobu et al., 2006) in the vicinity of Sb mine. Here a four-year field study (2007–2012) was conducted in Xikuangshan (XKS), Hunan Province, China, which is the largest active Sb mine in the world and is nicknamed the “World's Antimony Capital”. Many studies have been carried out in this area to understand the environmental behavior of Sb (Basnet et al., 2014; Fu et al., 2010; He, 2007; Liu et al., 2011; Liu et al., 2010; Okkenhaug et al., 2012; Qi et al., 2011; Wang et al., 2011; Wei et al., 2011; Wu et al., 2011). However, systematic comparison research focused on behavior between As and Sb in different environmental compartments are limited. The primary objective of this study was to compare the biogeochemical behavior of As with that of Sb in natural waters, soils and tailings. This study is based on the null hypothesis that As and Sb have different biogeochemical behavior under some conditions in the environmental compartments. China is one of the largest producers of Sb in the world, producing, on approximately 80% of global requirements (He et al., 2012; USGS, 2012). 2. Materials and methods 2.1. Site description The studied site, the Xikuangshan mining area, covers 70 km2, is situated between 27.7°N and 111.4°E in Hunan Province, in southwest China (Fig. 1). The XKS Sb mine is located on a large Sb deposit. The Sb deposit, which is about 2 km wide and 9 km long, sits in the northern part of the Xiangzhong Basin, a specific low-temperature mineralization depression zone with rich deposits of mercury (Hg), gold (Au), zinc (Zn), lead (Pb), As, Sb, and coal (Fan et al., 2004; Liu et al., 2010). Stibnite (Sb2S3) is the main ore mineral. The deposit also contains trace levels of pyrite (FeS2), pyrrhotite (Fe1 − xS), and sphalerite (ZnS) with primary gangue minerals such as quartz and calcite, and secondary such as barite and fluorite (Fan et al., 2004). The Sb mining history in Xikuangshan dates back to the nineteenth century with the first Sb smelter being constructed in 1897 and mining operations continue today. Qing river, a tributary of the Zi river, flows through the XKS mine area and receives a component of the mining and smelting drainage. Consequently, there are not any aquatic organisms downstream of the river. In contrast, fish and other aquatic organisms can be found in some small reservoirs (the main sampling sites of for waters and aquatic organisms) (Fig. 1, sites A-I) with no direct mine drainage input. There is no constructed boundary between the mining and residential areas. Lands in the mining area are extensively used for cultivation. Vegetables from these agricultural lands (the main sampling sites of soils and vegetables) (Fig. 1, sites S1–S8) supply most of the local residents. In the ore separation and smelting processes, huge amounts of ore-dressing residues, tailing particles, and smelter furnace clinkers are produced. These residues still contain high levels of Sb and other heavy metal contents compared to the uncontaminated environment. The tailings mixed with soils were either piled up untreated in the open air. Surprisingly, some plants can survive in such harsh environment (the main sampling sites of tailings and plants) (Fig. 1, sites T1–T6). More detailed information on the local environmental setting is available elsewhere (Fu et al., 2010; He, 2007; Liu et al., 2010; Wu et al., 2011). 2.2. Sample collection In the vicinity of the XKS smelter, a total of 75 water, 104 fish, 12 crab, 81 soil, 138 vegetable, 50 tailing and 135 plant samples were collected in December 2007, July 2008, December 2008, July 2009 and July 2012. Fish and corresponding samples of water (filtered with 0.45-μm filtration membranes in the field) were collected from 9 sites including rivers, ponds, reservoirs and paddy field with different distances from Sb smelting site (Fig. 1, Supplementary Material (SM) Table S1). Crabs (Portunus pelagicus) were collected in the river at site B. Fish included local common species, such as carp (Cyprinus carpio), grass carp (Ctenopharyngodon idellus), crucian (Carassius auratus) and wild carp (Hemiculter leucisculus). Vegetables and corresponding samples of soil (at 0–20 cm depths of the vegetable rhizosphere) were collected from 8 local agricultural lands near Sb smelter, tailing and residential site (Fig. 1, SM Table S2). Vegetables included leaf, tuber vegetables, and fruit. Three samples of soil were collected for comparison from agricultural lands in the control area of Guiyang City, located in southwest of China. Plants and corresponding samples of tailings were collected from 6 tailing heaps with different heaped time (Fig. 1, SM Table S3). Samples of tailings were sampled at both the top and the bottom of each tailing heap. Samples of plants included most of the wild plants observed to grow on tailings. 2.3. Preparation of sample and analytical methods Samples were immediately stored in ice-packed coolers and transported to the laboratory where they were stored at − 20 °C for fish samples and 2 °C for water samples. Samples of soils and tailings were air-dried at room temperature and ground to pass a 100 meshes sieve (i.e. 0.15 mm sieve size). Individual fish (thawed), vegetable and plant samples were rinsed individually with tap water and deionized water to remove possible metal contaminants. Fish organs including gill, liver, kidney, muscle, swim bladder, and skin were dissected out with a stainless steel scalpel. Crabs were divided into crab shells and other tissues after removal of the viscera. Vegetable and plant are divided into ground and underground parts. The separated portions of fishes, Z. Fu et al. / Science of the Total Environment 539 (2016) 97–104 99 Fig. 1. Map of the field study area with descriptions. vegetables, and plants samples were washed again with deionized water, freeze-dried (fishes and crabs) or oven dried at 40 °C for 96-hour (vegetables and plants) and ground into powders. Measurements of the pH of water samples occurred in the field with a portable pH meter of PHBJ-260 (Shanghai Leici, China). For soil and tailing samples pH was measured at solid/water ratio of 1:2.5 by use of PHS-3C pH meter (Shanghai Leici, China). Dissolved organic carbon (DOC) of water samples was measured by use of a High TOC II analyzer (Elementar, Germany). Organic matter (OM) of the soil samples were determined using the standard method described by Lu (Lu, 2000). The OM of tailings were not determined for all samples due to small contents in tailings (b10 g/kg) and the results of preliminary sampling indicated there was no statistical difference between samples. Total concentrations of Sb and As were determined by use of hydride generation-atomic fluorescence spectrometry (HG-AFS) with AFS-810 (Beijing Jitian, China) and PSA-10.055 (Millennium Excalibur System, United Kingdom). Operating conditions of AFS instrument were optimized and all calibration curves demonstrated good linearity (r N 0.999). Briefly, approximately 0.1 g aliquots of each biological sample were digested with 3 mL of high purity HNO3 and H2O2 (3/1, v/v) in acid-cleaned digestion vessels and approximately 0.5 g of each sample of soil or tailings were digested with 10 mL of HNO3 and H2SO4 (1:1, v/v) and a few drops of HF. These samples were digested by heating (b140 °C) in acid-cleaned digestion vessels (soil and tailings were digested in Teflon vessels) (for detail, see reference Fu et al., 2010; Wu et al., 2011). Digested samples were made up to 10 mL volume with Milli-Q water and left for 30 min until determination. All chemical reagents used were purchased from Sinopharm Chemical Reagent Co., Shanghai, China, except KBH4 (Sigma Chemical Co., St. Louis, MO., USA) and KI (Tianjin Fuchen Chemicals Reagents Co., Tianjin, China). All precautions were taken in order to avoid any crosscontamination during the process. Quality control included the analyses of method blanks, blank spikes, matrix spikes, blind duplicates and certified materials (CRMs). The CRMs included DOLT-3 (Dogfish liver) from National Research Council, Canada. Other CRMs obtained from the National Research Centre for Certified Reference Materials (China) were yellow-fin tuna (GBW08573), bush leaves (GBW07603), tomato leaves (ESP-1) and yellow red soils (GBW07406). The recoveries (Measured value/Certified value × 100%) for As and Sb in CRMs were in the range of 91–115% and 87–108%, respectively. All method blanks were observed to be below corresponding As and Sb detection limits (b10 ng/L for both As and Sb). The percentage of recoveries on spikes samples ranged from 93 to 110% for As and from 84 to 115% for Sb in all samples. The relative standard deviation (RSD) of duplicated samples was less than 7% for both As and Sb in samples. All samples with outliers were analyzed again by repeating the digestion and measurement procedure. 100 Z. Fu et al. / Science of the Total Environment 539 (2016) 97–104 2.4. Statistical analyses The statistical package SPSS for windows 16.0 (SPSS Inc., Chicago, Illinois, USA) was used for data analyses. Geometric means were used to describe the level of concentration of metals. Correlation coefficients were studied using Pearson and Spearman's correlation analysis. In detail, normality of data was confirmed by the Kolmogorov–Smirnov test. Data on the normal distribution were analyzed by use of Pearson correlation, while data on the non-normally distribution were analyzed by use of Spearman's correlation (non-parametric statistics). Independent-sample T-tests were performed to test the significance of different environmental compartments. Statistical tests were considered statistically significant if P b 0.05. 3. Results and discussion 3.1. Distribution of As and Sb Concentrations of As and Sb in the XKS waters with means of 2.48 (0.51–12.0) μg/L and 24.7 (5.59–163) μg/L, respectively. Approximately 18% and 95% of samples of water from the Sb mine area had concentrations of As and Sb that exceeded Chinese drinking water guidelines (As: 10 μg/L, Sb: 5 μg/L) (GB5749-2006, 2006) (Table 1). These values were significantly higher than those in river near Sb mine in Turkey (Sb:0.02–0.1 μg/L) (Duran et al., 2007), closed to those in river near abandoned Sb mine in New Zealand (As: 5.5–8.6 μg/L, Sb: 14–30 μg/L) (Wilson et al., 2004), but lower than those in stream (mine drainage input) adjacent to a Sb mine in Australia (As:46 ± 2 μg/L, Sb: 381 ± 23 μg/L) (Telford et al., 2009) and previously reported in XKS (Liu et al., 2010) due to no direct mine drainage input in our water sampling sites. Concentrations of As and Sb in the XKS soils with means of 69.8 (14.9–208) and 1315 (141–8733) mg/kg, dry mass (dm), respectively, were close to previously reported concentrations of As (3.5– 205.1 mg/kg) and Sb (101–5045 mg/kg) in soil of XKS (He, 2007). Soil As and Sb concentrations in this study were significantly (p b 0.01) greater than those from the control sites with mean less than 20 mg/kg, dm (Table 1), and greater than the second grade standard value of As (25–40 mg/kg) in China environmental quality standard for soils (GB15618-1995,1995) (Sb is absent in this standard). Greatest concentrations of As and Sb were found in tailings with means of 169 (29.1–853) and 3789 (684–17196) mg/kg, dm, respectively, which were twice as great as those in soils (Table 1). This results suggested that tailings piles are a potential important source of As and Sb in water and soils due to fact that the tailings were piled up untreated in the open air without constructed boundary with the soil. Another study reported in this area (Zhu et al., 2009) also suggested that interactions between water and tailings are important process controlling release and transport of As and Sb from mining/smelting sites into the streams. Concentrations of both As and Sb in waters and soils were inversely proportional to distance from the Sb smelter. Concentrations of As and Sb were approximately 10-fold greater in water from within 1.5 km of the Sb mine than concentrations 3–8 km from the smelter (Fig. 2a, the circled area). Concentrations of As and Sb in soils from sites S1, S2, S3 and S6, near the Sb smelter and tailings, were greater than those in other soils in the region (Table 1). These results indicated that concentrations of Sb and As in water and soil of the vicinity of the Sb mine Table 1 Chemical parameters and concentrations of As and Sb in XKS water, tailings and soil. Water Sampling site na As (μg/L) A B C D E F G H I 6 15 9 6 9 6 9 9 6 1.68 (1.62–1.74) 11.1 (10.8–11.8) 8.91 (7.03–12.0) 6.60 (3.46–10.3) 1.65 (0.94–2.40) 0.69 (0.65–0.73) 0.56 (0.51–0.60) 1.16 (1.03–1.38) 4.41 (3.9–5.34) Sampling site n As (mg/kg) T1 T2 T3 T4 T5 T6 9 9 8 11 7 6 Sampling site S1 S2 S3 S4 S5 S6 S7 S8 Control site Sb (μg/L) pH DOC (mg/L) 7.30 (6.93–7.40) 7.36 (6.86–7.66) 6.21 (5.78–6.47) 7.16 (6.83–7.50) 7.43 (7.22–7.60) 6.95 (6.52–7.21) 7.25 (6.79–7.62) 7.37 (7.35–7.40) 7.40 (7.08–7.73) 2.27 (2.06–3.01) 1.23 (0.89–1.31) 1.27 (0.99–1.40) 6.15 (2.26–9.86) 1.39 (0.96–1.64) 0.95 (0.63–1.28) 2.52 (2.05–3.52) 2.66 (2.32–2.96) 2.04 (1.72–2.42) Sb (mg/kg) pH OM (g/kg)b 116 (62.9–170) 161 (131–181) 103 (80.9–128) 217 (29.1–853) 226 (40.1–435) 251 (106–363) 5662 (2181–8226) 2463 (1322–4067) 1784 (1391–2167) 6495 (684–12581) 8784 (3132–17196) 2087 (1349–4438) 7.16 (6.51–7.75) 4.78 (4.01–5.65) 6.72 (6.39–7.02) 7.28 (6.27–7.93) 7.41 (7.03–7.67) 7.52 (6.98–7.74) b10 g/kg b10 g/kg b10 g/kg b10 g/kg b10 g/kg b10 g/kg n As (mg/kg) Sb (mg/kg) pH OM (g/kg) 9 12 8 6 8 6 16 13 3 91.5 (83.7–113) 101 (84.9–133) 103 (66.4–152) 29.3 (28.4–30.1) 43.6 (14.9–72.3) 169 (96.7–208) 60.5 (19.9–169) 45.5 (19.1–141) 12.7 (9.00–16.82) 4544 (2548–6087) 6070 (2356–8733) 1438 (524–2303) 404 (391–425) 248 (141–355) 6946 (3978–8623) 827 (157–4237) 392 (197–547) 3.23 (2.32–4.56) 6.42 (5.62–7.08) 5.44 (5.27–6.13) 6.82 (6.60–7.01) 6.93 (6.70–7.15) 5.98 (6.94–5.02) 7.46 (6.92–7.78) 6.94 (5.38–7.41) 6.36 (5.67–6.99) 6.78 (5.19–7.64) 45.5 (29.8–69.7) 79.9 (41.1–111.5) 78.7 (51.0–139.8) 31.1 (29.5–32.5) 46.9 (20.5–73.3) 17.3 (12.6–28.5) 36.6 (19.7–65.1) 55.2 (37.6–73.2) 54.4 (36.8–74.2) 81.8 (76.6–8.7) 90.7 (65.8–140) 156 (151–163) 43.7 (10.3–80.0) 6.67 (5.59–7.93) 8.70 (7.88–9.53) 10.4 (10.3–10.4) 8.66 (7.78–9.36) 13.2 (11.6–15.0) Tailing Soil a n refers to the number of samples. The OM of tailings were not determined for all samples due to small contents in tailings (b10 g/kg) and the results of preliminary sampling indicated there was no statistical difference between samples. b Z. Fu et al. / Science of the Total Environment 539 (2016) 97–104 101 Fig. 2. Correlations between concentrations of Sb and As in XKS area. area were seriously affected by Sb smelting and mine waste management activities. Deposition of As and Sb in dust and percolation of tailing leachate were suggested as the primary mechanisms of transport. Despite the similarities of spatial distributions between As and Sb in waters and soils, differences in distributions of As and Sb in tailings were observed as a function of time (Fig. 3). In heaps of tailings that were 5 to 10 years old, concentrations of Sb in tailings on top were always greater than those at the bottom of heaps of tailings. In contrast, concentrations of As in tailings on the top of the heap decreased as a function of time while those near the bottom increased. No significant differences in concentrations of Sb were observed in tailings between different heaped years. In contrast, concentrations of As in tailings near the top of heaps that were 15 years old were significantly less than those in tailings that had weathered for 5 years. The different temporal distributions of As and Sb observed in tailings suggested that mobility of Sb was less than that of As. Recently less mobility of Sb than As were reported in soil of Pb–Sb mining area: Sb was found mostly (97.6 to 99.6%) in the residual fraction of soil, whereas the residual fraction of As (58.3–98.8%) was lower (Álvarez-Ayuso et al., 2012). Significantly positive correlations between concentrations of As and Sb were observed in water (r = 0.757, p b 0.01), soils (r = 0.512, p b 0.01), and tailings (r = 0.596, p b 0.01) (Fig. 2), suggesting common sources as well as similar environmental behavior of As and Sb in XKS. Similar broad correlations between concentrations of As and Sb in environmental compartments have been reported. For instance, similar seasonal variations in surface water (Masson et al., 2009), similar mobilized Fig. 3. Distribution and temporal trends in concentrations of As and Sb in tailings. Independent-sample t tests: (1) top and bottom tailings: heaped 5 years, As: p = 0.023**, Sb: p = 0.001**; heaped 15 years, As: p = 0.211, Sb: p = 0.003**. (2) 5 and 15 years: top tailings, As: p = 0.003**, Sb: p = 0.279; bottom tailings, As: p = 0.005**, Sb: p = 0.011**. mechanism in groundwater (Willis et al., 2011), and similar little mobilization in soil leached by deionized water (Müller et al., 2007). 3.2. Biological accumulation of As and Sb Concentrations of As in the XKS fishes, plants and vegetables with means of 86.8 (1.0–1112) μg/kg, 13.5 (0.14–609) mg/kg and 2.32 (0.08–10.7) mg/kg, dry mass (dm), respectively. Concentrations of Sb in the XKS fishes, plants and vegetables had means of 59.8 (1.01– 1937) μg/kg, 13.4 (1.31–91.0) mg/kg and 14.1 (0.38–84.1) mg/kg, dry mass (dm), respectively. Sb concentrations in vegetables were closed to the concentrations reported by He (2007) in leaves of radish plants from the same area (1.5–121 mg/kg). But Sb concentrations in plants were substantially lower than the concentrations reported by Okkenhaug et al. (2011) from the same area (109–4029 mg/kg). Bioaccumulation potentials of As and Sb were clearly different. Although concentrations of As in waters, tailings and soils were approximate an order of magnitude less than those of Sb, concentrations of As in fishes, plants and vegetables were generally close to that of Sb (SM Table S4). The Bioaccumulation factors (BAFs, i.e. organism/exposure source concentration ratios to reflect the bioavailability of metal) calculated for As were approximate 10-fold greater than those of Sb in fish/water, plant/tailing and vegetable/soil systems (Fig. 4, SM Table S4), which suggests that As and Sb might be bioaccumulated via different mechanisms. Fish, plants and vegetables all tended to accumulate As but not Sb. Relatively low bioavailability of Sb has been reported in soils and plants (Hammel et al., 2000; He, 2007), in grass and small mammals (Ainsworth et al., 1990b), in soils and human (Gebel et al., 1998), in sediments and aquatic plants (Telford et al., 2009), in waters and fishes (Fu et al., 2010). Our observations suggested lower bioavailability of Sb than As in fish/water, plant/tailing and vegetable/soil (Table 2). Distributions of bioaccumulation were generally similar for As and Sb. Both elements tended to be more accumulated by common carp (H. leucisculus and C. carpio) than grass carp (C. idellus) (n = 31, p b 0.05) (Fig. 4a). This suggested that the grass carp (herbivorous fish), which mainly inhabit the surface layer of aquatic environments, had less access to greater concentrations of Sb in sediments (Filella et al., 2002; Fu et al., 2010). Both elements tended to be more accumulated by leafy vegetables than other vegetables (Fig. 4c). This suggested those leaves that have been directly affected by deposition of Sb and from the atmosphere in the region around XKS. In fact, previous studies have reported that concentrations of Sb in leaves in XKS and other areas with ongoing Sb smelting operations are usually greater than those in the roots (Ainsworth et al., 1990a; He, 2007), but no significant difference in concentrations of Sb between leaves and roots was observed in areas near an abandoned Sb mine (Baroni et al., 2000). Both As and Sb exhibited significant accumulation in plants of the family Pteridaceae, including Pteris vittata and Pteris henryi (Fig. 4b). This is not surprising due to P. vittata has been demonstrated as to be a hyper-accumulator of As (Ma et al., 2001). But our results indicated 102 Z. Fu et al. / Science of the Total Environment 539 (2016) 97–104 Table 2 Concentrations of As and Sb in XKS fish, plant and vegetables (expressed in geometric means of concentrations in all the organism parts). Fish Sampling site na A C D E F G H I 7 24 14 21 2 13 15 8 As (μg/kg) 175 (156–188) 277 (25.8–690) 43.2 (1.00–147) 84.6 (5–1112) 94.1 (18.4–202) 73.6 (16.7–179) 63.1 (14.8–151) 41.6 (10.2–79.7) Sb (μg/kg) 339 (207–537) 602 (237–1937) 38.8 (2.21–191) 62.5 (1.80–1173) 14.1 (1.01–31.9) 31.5 (2.28–79.9) 29.3 (2.61–122) 25.3 (1.46–88.0) Plant Sampling site n T1 T2 T3 T4 T5 T6 26 22 19 27 23 18 As (mg/kg) 47.5 (1.83–609) 7.23 (1.78–14.5) 3.80 (0.23–11.8) 9.19 (0.14–78.4) 31.1 (0.69–519) 16.1 (0.78–71.5) Sb (mg/kg) 11.2 (1.31–44.6) 9.56 (4.53–18.4) 6.58 (1.71–27.7) 18.9 (2.24–67.8) 17.2 (1.76–75.1) 25.2 (4.41–91.0) Vegetables Sampling sites n As (mg/kg) Sb (mg/kg) S1 S2 S3 S4 S5 S6 S7 S8 18 18 15 11 8 15 23 30 3.85 (0.34–5.59) 4.36 (0.19–8.63) 3.68 (0.43–10.7) 3.26 (0.46–8.99) 1.41 (0.14–6.74) 3.77 (0.19–10.1) 0.813 (0.33–2.30) 0.975 (0.08–7.06) 17.0 (1.59–43.1) 30.0 (1.15–55.2) 20.6 (2.11–69.3) 14.6 (1.18–31.2) 10.2 (0.400–49.8) 30.8 (1.58–84.1) 3.65 (0.55–13.0) 9.04 (0.38–30.3) a Fig. 4. BAFs of As and Sb in XKS area (a: fish/water at different sites; b: plant/tailings in different family of plant; c: vegetable/soil in different species of vegetables). BAFs of As and Sb in organisms were calculated in accordance with concentrations of metal in mixed biological samples. The vegetables in this figure refer to the edible part of vegetable samples. that P. vittata is not an hyper-accumulator for Sb due to BAFs of Sb were less than 1 (geometric mean of 0.031). Accumulation of As and Sb varied among biological tissue of fish and crab samples. Arsenic was preferentially accumulated into liver and kidney of fishes (SM Figure S1), which were recognized as the excretory and detoxification organs. In contrast, greatest accumulations of Sb were found in non-lipid tissues such as gills of fishes (n = 27) and shells of crab (n = 12), whereas As was not (Fig. 5). There should be receptors biological ligands for Sb in non-lipid tissues, but the mechanism remains unclear. Our results were consistent with previous results: Lower concentrations of Sb were reported in fat compared to brain, kidney, liver and spleen of rats (Poon et al., 1998), whereas significant amounts of n refers to the number of samples. As were concentrated in the fat fraction rather than in the non-lipid fractions in tissues of sheep (Devalla and Feldmann, 2003). Soils exhibited a range of pH values from 5.19–7.78. BAFs for accumulation of Sb from soil to vegetables were positively correlated with the pH of soil for both cabbage (r = 0.164, p N 0.05) and radish (r = 0.487, p N 0.05), the dominant local vegetables (Fig. 6). The statistically insignificant correlations suggested that BAFs of Sb in vegetable/soil were affected by other importance factors as well (e.g., genotype, soil type, the properties of phytochelatins), that has not been addressed in the present study. In contrast, As exhibited the opposite trend for both cabbage (r = − 0.412, p N 0.05) and radish (r = − 0.223, p N 0.05) (Fig. 6). Positive correlations between Sb bioavailability and pH in soil were in agreement with the previous reported results (Hammel et al., 2000) that the mobility of Sb decreases with decreasing acidity of the soils. This suggested that the co-precipitation and adsorbed Sb(V) (including easily and rapidly oxidized Sb(III)) on iron-minerals, the main mineral composition of Sb ores in XKS (Fan et al., 2004), would be released with increasing pH especially at pH values above pH 7 (Leuz et al., 2006a; Leuz et al., 2006b; Ritchie et al., 2013). Although Sb exhibited positive correlations between concentrations of Sb in tailings and in the corresponding plants of the family Loganiaceae (Buddleja davidii) (r = 0.645, p N 0.05), the dominant local wild plant, significantly negative correlations were found between concentrations of As in tailings and in family Loganiaceae (r = −0.581, p b 0.01) (SM Figure S2). This suggested that accumulation of As into wild plants was not dependent on total concentrations of As in tailings, which can be attributed to the strong mobility of As and variation of pH in tailings. Concentrations of As in surface tailings were inversely proportional to duration they had been stacked (Fig. 3) and accompanied acidification of the tailings due to the sulfide contained in the tailings. The pH in surficial tailings that had been heaped for only one year was 7.28. In contrast, the average pH of surface tailings that had been weathered for 15 years was 4.28 due to H2SO4 generated from oxidation of Z. Fu et al. / Science of the Total Environment 539 (2016) 97–104 103 Fig. 5. Bio-accumulation factors (BAFs) of As and Sb in biological organs/water. sulfide minerals in tailings. As a result, although concentrations of As in surface tailings decreased with duration of stacking, bioavailability of As increased due to the lower pH. Hence As exhibited a significantly negative correlation between concentrations in Loganiaceae and tailings. This supported the higher mobility of As than Sb in tailings discussed in the above section of “distribution of As and Sb”. fish/water, plant/tailing and vegetable/soil systems. Sb was more accumulated than As into non-fatty tissues such as gills of fishes and shells of crabs. BAFs of Sb and As in vegetable/soil exhibited different insignificantly positive correlation with pH in soil. Changes in pH were also found to be a significant factor influencing different mobility of As and Sb over time. 4. Conclusion Acknowledgments In this study, significant differences in mobility, bioavailability and bioaccumulation distribution between As and Sb were observed. Different temporal distributions of As and Sb observed in tailings suggested that mobility of Sb was less than that of As. Bio-accumulation factors (BAFs) of As were approximately 10-fold greater than those of Sb in This work was jointly supported by National Natural Science Foundation of China (41473109, 41003047 and 41373027) and National Basic Research Program of China (2008CB418200). The authors wish to thank Dr. Jianyang Guo and Dr. Yongsan Zhang for their help during the sampling process. Fig. 6. Correlations between soil pH and BAFs of As and Sb in cabbage and radish. 104 Z. Fu et al. / Science of the Total Environment 539 (2016) 97–104 Appendix A. Supplementary data Supplementary data to this article can be found online at http://dx. doi.org/10.1016/j.scitotenv.2015.08.146. References Abernathy, C., Liu, Y., Longfellow, D., Aposhian, H., Beck, B., Fowler, B., et al., 1999. Arsenic: health effects, mechanisms of actions, and research issues. Environ. Health Perspect. 107, 593. Ahmed, M.F., Ahuja, S., Alauddin, M., Hug, S.J., Lloyd, J.R., Pfaff, A., et al., 2006. Ensuring safe drinking water in Bangladesh. Science 314, 1687–1688. Ainsworth, N., Cooke, J., Johnson, M., 1990a. Distribution of antimony in contaminated grassland: 1—vegetation and soils. Environ. Pollut. 65, 65–77. Ainsworth, N., Cooke, J., Johnson, M., 1990b. Distribution of antimony in contaminated grassland: 2—small mammals and invertebrates. Environ. Pollut. 65, 79–87. Álvarez-Ayuso, E., Otones, V., Murciego, A., García-Sáncheza, A., Regina, I.S., 2012. Antimony, arsenic and lead distribution in soils and plants of an agricultural area impacted by former mining activities. Sci. Total Environ. 439, 35–43. Amarasiriwardena, D., Wu, F., 2011. Antimony: emerging toxic contaminant in the environment. Microchem. J. 97, 1–3. Baroni, F., Boscagli, A., Protano, G., Riccobono, F., 2000. Antimony accumulation in Achillea ageratum, Plantago lanceolata and Silene vulgaris growing in an old Sb-mining area. Environ. Pollut. 109, 347–352. Basnet, P., Amarasiriwardena, D., Wu, F., Fu, Z., Zhang, T., 2014. Elemental bioimaging of tissue level trace metal distributions in rice seeds (Oryza sativa L.) from a mining area in China. Environ. Pollut. 195, 148–156. Chowdhury, U., Biswas, B., Chowdhury, T., Samanta, G., Mandal, B., Basu, G., et al., 2000. Groundwater arsenic contamination in Bangladesh and West Bengal, India. Environ. Health Perspect. 108, 393–397. Devalla, S., Feldmann, J., 2003. Determination of lipid-soluble arsenic species in seaweedeating sheep from Orkney. Appl. Organomet. Chem. 17, 906–912. Dixit, S., Hering, J.G., 2003. Comparison of arsenic (V) and arsenic (III) sorption onto iron oxide minerals: implications for arsenic mobility. Environ. Sci. Technol. 37, 4182–4189. Duran, M., Kara, Y., Akyildiz, G., Ozdemir, A., 2007. Antimony and heavy metals accumulation in some macroinvertebrates in the Yesilirmak river (N Turkey) near the Sb-mining area. Bull. Environ. Contam. Toxicol. 78, 395–399. EU, 1976. Council Directive 76/464/EEC of 4 May 1976 on pollution caused by certain dangerous substances discharged into the aquatic environment of the community. Off. J. L 129, 23–29. Fan, D., Zhang, T., Ye, J., 2004. The Xikuangshan Sb deposit hosted by the Upper Devonian black shale series, Hunan, China. Ore Geol. Rev. 24, 121–133. Filella, M., Belzile, N., Chen, Y., 2002. Antimony in the environment: a review focused on natural waters: I. Occurrence. Earth-Sci. Rev. 57, 125–176. Filella, M., Belzile, N., Lett, M., 2007. Antimony in the environment: a review focused on natural waters. III. Microbiota relevant interactions. Earth-Sci. Rev. 80, 195–217. Frisbie, S., Ortega, R., Maynard, D., Sarkar, B., 2002. The concentrations of arsenic and other toxic elements in Bangladesh's drinking water. Environ. Health Perspect. 110, 1147–1154. Fu, Z., Wu, F., Amarasiriwardena, D., Mo, C., Liu, B., Zhu, J., et al., 2010. Antimony, arsenic and mercury in the aquatic environment and fish in a large antimony mining area in Hunan, China. Sci. Total Environ. 408, 3403–3410. GB15618, 1995. China environmental quality standard for soils. Standard Publishing House of China, Beijing. GB5749, 2006. China Standard for Drinking Water Quality. Standard Publishing House of China, Beijing. Gebel, T., 1999. Arsenic and drinking water contamination. Science 283, 1458–1459. Gebel, T., Suchenwirth, R., Bolten, C., Dunkelberg, H., 1998. Human biomonitoring of arsenic and antimony in case of an elevated geogenic exposure. Environ. Health Perspect. 106, 33–39. Hale, M., 1981. Pathfinder applications of arsenic, antimony and bismuth in geochemical exploration. J. Geochem. Explor. 15, 307–323. Hammel, W., Debus, R., Steubing, L., 2000. Mobility of antimony in soil and its availability to plants. Chemosphere 41, 1791–1798. Hawkes, H.E., Webb, J.S., 1962. Geochemistry in Mineral Exploration. Harper & Row, New York. He, M., 2007. Distribution and phytoavailability of antimony at an antimony mining and smelting area, Hunan, China. Environ. Geochem. Health 29, 209–219. He, M., Wang, X., Wu, F., Fu, Z., 2012. Antimony pollution in China. Sci. Total Environ. 421, 41–50. Leuz, A.K., Mönch, H., Johnson, C.A., 2006a. Sorption of Sb (III) and Sb (V) to goethite: influence on Sb (III) oxidation and mobilization. Environ. Sci. Technol. 40, 7277–7282. Leuz, A.K., Hug, S.J., Wehrli, B., Johnson, C.A., 2006b. Iron-mediated oxidation of antimony (III) by oxygen and hydrogen peroxide compared to arsenic (III) oxidation. Environ. Sci. Technol. 40, 2565–2571. Li, X., Thornton, I., 1993. Arsenic, antimony and bismuth in soil and pasture herbage in some old metalliferous mining areas in England. Environ. Geochem. Health 15, 135–144. Liu, F., Le, X., McKnight-Whitford, A., Xia, Y., Wu, F., Elswick, E., et al., 2010. Antimony speciation and contamination of waters in the Xikuangshan antimony mining and smelting area, China. Environ. Geochem. Health 32, 1–13. Liu, B., Wu, F., Li, X., Fu, Z., Deng, Q., Mo, C., et al., 2011. Arsenic, antimony and bismuth in human hair from potentially exposed individuals in the vicinity of antimony mines in Southwest China. Microchem. J. 97, 20–24. Lu, R., 2000. Analysis Methods on Soil Agro-chemistry. Chinese Agricultural Science and Technology Press, Beijing. Ma, L.Q., Komar, K.M., Tu, C., Zhang, W., Cai, Y., Kennelley, E.D., 2001. A fern that hyperaccumulates arsenic. Nature 409, 579. Masson, M., Schäfer, J., Blanc, G., Dabrin, A., Castelle, S., Lavaux, G., 2009. Behavior of arsenic and antimony in the surface freshwater reaches of a highly turbid estuary, the Gironde Estuary, France. Appl. Geochem. 24, 1747–1756. Mitsunobu, S., Harada, T., Takahashi, Y., 2006. Comparison of antimony behavior with that of arsenic under various soil redox conditions. Environ. Sci. Technol. 40, 7270–7276. Müller, K., Daus, B., Morgenstern, P., Wennrich, R., 2007. Mobilization of antimony and arsenic in soil and sediment samples—evaluation of different leaching procedures. Water Air Soil Pollut. 183, 427–436. Okkenhaug, G., Zhu, Y., Luo, L., Lei, M., Li, X., Mulder, J., 2011. Distribution, speciation and availability of antimony (Sb) in soils and terrestrial plants from an active Sb mining area. Environ. Pollut. 159, 2427–2434. Okkenhaug, G., Zhu, Y., He, J., Li, X., Luo, L., Mulder, J., 2012. Antimony (Sb) and arsenic (As) in Sb mining impacted paddy soil from Xikuangshan, China: differences in mechanisms controlling soil sequestration and uptake in rice. Environ. Sci. Technol. 46, 3155–3162. Poon, R., Chu, I., Lecavalier, P., Valli, V., Foster, W., Gupta, S., et al., 1998. Effects of antimony on rats following 90-day exposure via drinking water. Food Chem. Toxicol. 36, 21–35. Qi, C., Wu, F., Deng, Q., Liu, G., Mo, C., Liu, B., et al., 2011. Distribution and accumulation of antimony in plants in the super-large Sb deposit areas, China. Microchem. J. 97, 44–51. Ritchie, V.J., Ilgen, A.G., Mueller, S.H., Trainor, T.P., Goldfarb, R.J., 2013. Mobility and chemical fate of antimony and arsenic in historic mining environments of the Kantishna Hills district, Denali National Park and Preserve, Alaska. Chem. Geol. 335, 172–188. Seyfferth, A.L., Webb, S.M., Andrews, J.C., Fendorf, S., 2010. Arsenic localization, speciation, and co-occurrence with iron on rice (Oryza sativa L.) roots having variable Fe coatings. Environ. Sci. Technol. 44, 8108–8113. Shotyk, W., Krachler, M., Chen, B., 2005. Antimony: global environmental contaminant. J. Environ. Monit. 7, 1135–1136. Smith, K.S., Huyck, H.L., 1999. An overview of the abundance, relative mobility, bioavailability, and human toxicity of metals. Environ. Geochem. Miner. Depos. 6, 29–70. Telford, K., Maher, W., Krikowa, F., Foster, S., Ellwood, M.J., Ashley, P.M., et al., 2009. Bioaccumulation of antimony and arsenic in a highly contaminated stream adjacent to the Hillgrove Mine, NSW, Australia. Environ. Chem. 6, 133–143. Tschan, M., Robinson, B.H., Schulin, R., 2009. Antimony in the soil–plant system—a review. Environ. Chem. 6, 106–115. USEPA., 1979. Water Related Fate of the 129 Priority Pollutants. vol. 1. USEPA, Washington, DC, USA. USGS, 1995-2013. Mineral Commodity Summaries. USGS, 2012. Mineral Commodity Summaries. Wang, X., He, M., Xi, J., Lu, X., 2011. Antimony distribution and mobility in rivers around the world's largest antimony mine of Xikuangshan, Hunan Province, China. Microchem. J. 97, 4–11. Wei, C., Deng, Q., Wu, F., Fu, Z., Xu, L., 2011. Arsenic, antimony, and bismuth uptake and accumulation by plants in an old antimony mine, China. Biol. Trace Elem. Res. 144, 1150–1158. Willis, S.S., Haque, S.E., Johannesson, K.H., 2011. Arsenic and antimony in groundwater flow systems: a comparative study. Aquat. Geochem. 17, 775–807. Wilson, N.J., Craw, D., Hunter, K., 2004. Antimony distribution and environmental mobility at an historic antimony smelter site. N. Z. Environ. Pollut. 129, 257–266. Wilson, S.C., Lockwood, P.V., Ashley, P.M., Tighe, M., 2010. The chemistry and behaviour of antimony in the soil environment with comparisons to arsenic: a critical review. Environ. Pollut. 158, 1169–1181. Wu, F., Fu, Z., Liu, B., Mo, C., Chen, B., Corns, W., et al., 2011. Health risk associated with dietary co-exposure to high levels of antimony and arsenic in the world's largest antimony mine area. Sci. Total Environ. 409, 3344–3351. Zheng, J., Ohata, M., Furuta, N., 2000. Studies on the speciation of inorganic and organic antimony compounds in airborne particulate matter by HPLC–ICP-MS. Analyst 125, 1025–1028. Zhu, J., Wu, F., Deng, Q., Shao, S., Mo, C., Pan, X., et al., 2009. Environmental characteristics of water near the Xikuangshan antimony mine, Hunan Province. Acta Sci. Circumst. 29, 655–661 (in Chinese). Supplementary Material Comparison of arsenic and antimony biogeochemical behavior in water, soil and tailings from Xikuangshan, China Zhiyou Fu,a Fengchang Wu, a,* Changli Mo,b Qiujing Deng,c Wei Meng,a John P. Giesyd,e a State Key Laboratory of Environmental Criteria and Risk Assessment, Chinese Research Academy of Environmental Sciences, Beijing 100012, China b Teaching Equipment and Laboratory Management Center, Guiyang University, Guiyang 550005, China c College of Resources and Environmental Engineering, Guizhou University, Guiyang 550002, 265647 China d Department of Veterinary Biomedical Sciences and Toxicology Centre, University of Saskatchewan, Saskatoon, Saskatchewan, Canada e Zoology Dept. and Center for Integrative Toxicology, Michigan State University, East Lansing, MI 48824, USA *Professor Fengchang Wu will be the corresponding author for this paper Phone: +86-010-84915312 Fax: +86-010-84931804 E-mail: wufengchang@vip.skleg.cn 1 Table S1. Number of samples and sampling site description of water-fish system Site Site name Sampling date A Nankuang Jul.2008, July 2012 B Shuichang C Dec.2007, Jul.2008, July 2012 Dec.2007, Jul.2008, Shuichang July 2012 D Yangjia Dec.2007, Jul.2008 E Shengli Dec.2007, Jul.2008, July 2012 F Shengli Jul.2008 G Fuyuan Jul.2008, July 2012 H Minzhu Dec.2007, Jul.2008, July 2012 I Tongxing Jul.2008, July 2012 Site descriptions Pond 1km from the Sb smelting site River 1km from the Sb smelting site Reservoir 1km from the Sb smelting site Pond 1.5km from the Sb smelting site Reservoir 3km from the Sb smelting site Paddy field 3km from the Sb smelting site Reservoir 4km from the Sb smelting site Reservoir 5km from the Sb smelting site Pond 8km from the Sb smelting site * Crab were collected in this site where no fish was sampled. 2 Water Fish Common name (species) of fish 6 7 15 12* Crab (Portunus pelagicus) 9 24 Crucian, Grass carp (Ctenopharyngodon idellus), Wild carp (Hemiculter leucisculus) 6 14 Crucian, Grass carp 9 21 Grass carp, Crucian, Peters) 6 2 Grass carp 9 13 Grass carp, Crucian, Carp (Cyprinus carpio) 9 15 Grass carp, Crucian, Bighead crap (Aristichthys mobilis) 6 8 Grass carp,Herring Crucian (Carassius auratus) Herring (Mylopharyngodon Table S2. Numbers of samples and sampling site description of soil-vegetable system Site Site name Sampling date Site descriptions Soil Vegetable S1 Beikuang July 2008, July 2009, July 2012 Vegetable field near abandoned ore 9 18 S2 Beikuang July 2008, July 2009, July 2012 Vegetable field near northern smelter of Sb (distance≤1 km) 12 18 S3 Nankuang July 2008, July 2009, July 2012 8 15 S4 Nankuang July 2008, July 2009, July 2012 6 11 S5 Weishaba July 2008, July 2009, July 2012 Vegetable field near southern smelter of Sb (distance≤1 km) Vegetable field of residential area near southern smelter of Sb (distance≤1.5 km) Vegetable field downstream of the tailing dam (distance≤1 km) 8 8 S6 Shuichan g July 2008, July 2009, July 2012 Vegetable field below the tailing and abandoned ore (distance≤0.3 km) 6 15 S7 Yangjia July 2008, July 2009, July 2012 Vegetable field near southern smelter of Sb (distance≤2 km) 16 23 S8 Yangjia July 2008, July 2009, July 2012 Vegetable field downstream of the tailing dam (distance≤2 km) 13 30 Control Guiyang July 2008 Vegetable field of village 3 3 Common name (species) of vegetable Radish (Raphanus sativus L.), Chinese Chrysanthemum(Chrysanthemum coronarium L.), Lettuce (Lactuca sativa L.), Celery (Apium graveolens L.), Chinese cabbage (Brassica pekinensis (Lour.) Rupr.), Pumpkin (Cucurbita moschata) Chinese cabbage, Pepper (Capsicum annuum L.), Radish, Potato (Solannum tuberosum L.), Taro (Colocasia esculenta (L.) Schoot), Pumpkin, Cowpea (Vigna unguiculata (L.) Walp.), Eggplant (Solanum melongena L.), Corn (Zea mays L.) Radish, Onion (Allium fistulosum L.), Lettuce, Sweet potato (Ipomoea batatas (Lam.) L.), Pepper Chinese cabbage, Radish, Eggplant, Rapeseed (Brassica campestris L.), Luffa (Luffa cylindrica (L.) Roem.), Garlic (sativum L.), Corn (Zea mays L.) Chinese cabbage, Radish, Lettuce, Cabbage (Brassica oleracea L.), Pumpkin Coriander (Coriandrum sativum), Radish, Pumpkin, Rapeseed (Brassica campestris L.), Chinese Chrysanthemum, Ipomoea (Ipomoea aquatica Forsskal), Bitter (Momordica charantia L.), Corn (Zea mays L.) Sweet potato, Lettuce, Chinese cabbage, Pumpkin, Radish, Rapeseed, Garlic (sativum L.), Pepper, Cowpea, Celery, Corn Chinese cabbage, Carrot (Daucus carota L. var. Sativa Hoffm.), Chinese Chrysanthemum, Lettuce, Garlic, Coriander, Lentils (Lablab purpureus (L.) Sweet), Cowpea, Corn Table S3. Number of samples and sampling site description of tailing-plant system Site Site name Sampling date Site descriptions Tailing Plant T1 Beikuang December 2006, December 2007, July 2008, July 2012 Bottom taling heaped 15 years 9 26 T2 Beikuang December 2006, December 2007, July 2008, July 2012 Top taling heaped 15 years 9 22 T3 Beikuang December 2006, December 2007, July 2008, July 2012 Old mine seam 8 19 T4 Nankuang December 2006, December 2007, July 2008, July 2012 Taling heaped 1 year 11 27 T5 Yangjia December 2006, December 2007, July 2008, July 2012 Bottom taling heaped 5 years 7 23 T6 Yangjia December 2006, December 2007, July 2008, July 2012 Top taling heaped 5 years 6 18 4 Family (Species) of plant Asteraceae (Aster ageratoides), Loganiaceae (Buddleja davidii), Chenopodiaceae (Chenopodium album L.), Poaceae (Eriochloa villosa), Caprifoliaceae (Lonicera japonica), Valerianaceae (Patrinia angustifoli), Polygonaceae (Polygonum multiflorum), Pteridaceae (Pteris henryi), Rosaceae (Pyracntha fortunei), Rubiaceae (Rubia leiocaulis), Poaceae (Themeda villosa), Palmae (Trachycarpus fortune) Loganiaceae (Buddleja davidii), Gleicheniaceae (Dicranopteris pedata), Poaceae (Erigeron annuus), Dryopteridaceae (Polisticum tsus-sime), Rosaceae (Rubus parvifoius), Poaceae (Saccharum arundinace) Pteridaceae (Pteris vittata), Pteridaceae (Pteris henryi), Asteraceae (Dendranthema indicum), Polygonaceae (Polygonum multifloru), Palmae (Trachycarpus fortune) Asteraceae (Bidens tripartita), Loganiaceae (Buddleja davidii), Urticaceae (Debregeasia edulis), Moraceae (Ficus pumila), Asteraceae (Inula coppa), Leguminosae (Pueratia phaseoloide), Poaceae (Saccharum arundinace) Asteraceae (Ainsliaea bonatii), Asteraceae (Bidens tripartita), Chenopodiaceae (Chenopodium. Ambrosi), Urticaceae (Debregeasia edulis), Asteraceae (Dendranthema indicum), Polygonaceae (Fagopyrum tataricum), Moraceae (Ficus pumila), Equisetaceae (Hippochcaete ramosi), Polygonaceae (Polygonum multiflorum), Poaceae (Saccharum arundinace) Loganiaceae (Buddleja davidii), Asteraceae (Ainsliaea bonatii), Urticaceae (Debregeasia edulis), Poaceae (Themeda villosa) Table S4. Concentratins (Geo Mean) of As and Sb in water, tailings and soil and in fish, wild plants and vegetables, and Bio-accumulation factor (BAF) in the XKS Sb mine area. As Sb Water(μg/L) 2.48 24.8 Tailings 169 3790 Concentration (mg/kg) Soil Fish(μg/kg) 62.9 86.8 1337 59.8 Wild plant 13.5 13.4 5 Vegetable 2.32 14.1 Bio-accumulation factor Fish Wild plant Vegetable 46.1 0.066 1.50 1.99 0.0025 0.29 1000 BAFs (Fish organ / Water) As Sb n=19 100 n=31 n=27 n=43 n=37 n=41 Liver Bladder Muscle Skin 10 1 Gill Kidney Figure S1. BAFs of As and Sb in fish organs/water 6 Buddleja (mg/kg) Cabbage (mg/kg) Fish liver (μg/kg) 300 300 Sb 200 As 200 r=0.645, p>0.05 100 100 0 0 0 70 140 5 Water (μg/L)0 r=0.392, p<0.05 6 12 5 Sb 4 r=0.645, p>0.05 4 As r=0.224, p>0.05 3 3 2 2 1 0 60 2000 4000 6000 Soil (mg/kg) 60 Sb 40 r=0.645, p>0.05 30 60 90 As r=-0.581, p<0.01 30 20 0 0 3000 6000 9000 100 200 300 400 Tailing (mg/kg) Figure S2. Correlations of metal concentrations between in environment and in biological compartments. 7
