Roane State Community College Enrollment Synopsis Spring 2012
advertisement
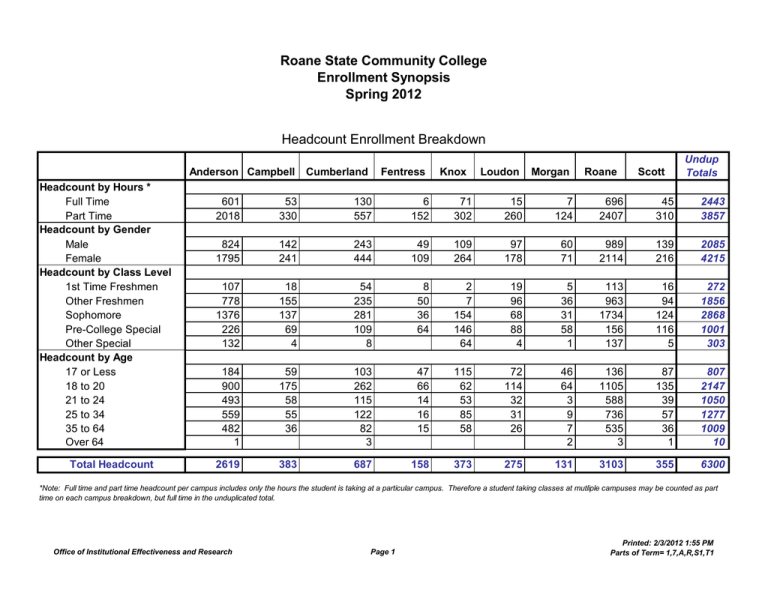
Roane State Community College Enrollment Synopsis Spring 2012 Headcount Enrollment Breakdown Anderson Campbell Headcount by Hours * Full Time Part Time Headcount by Gender Male Female Headcount by Class Level 1st Time Freshmen Other Freshmen Sophomore Pre-College Special Other Special Headcount by Age 17 or Less 18 to 20 21 to 24 25 to 34 35 to 64 Over 64 Total Headcount Cumberland Fentress Knox Loudon Morgan Roane Scott Undup Totals 601 2018 53 330 130 557 6 152 71 302 15 260 7 124 696 2407 45 310 2443 3857 824 1795 142 241 243 444 49 109 109 264 97 178 60 71 989 2114 139 216 2085 4215 107 778 1376 226 132 18 155 137 69 4 54 235 281 109 8 8 50 36 64 2 7 154 146 64 19 96 68 88 4 5 36 31 58 1 113 963 1734 156 137 16 94 124 116 5 272 1856 2868 1001 303 184 900 493 559 482 1 59 175 58 55 36 103 262 115 122 82 3 47 66 14 16 15 115 62 53 85 58 72 114 32 31 26 46 64 3 9 7 2 136 1105 588 736 535 3 87 135 39 57 36 1 807 2147 1050 1277 1009 10 2619 383 687 158 373 275 131 3103 355 6300 *Note: Full time and part time headcount per campus includes only the hours the student is taking at a particular campus. Therefore a student taking classes at mutliple campuses may be counted as part time on each campus breakdown, but full time in the unduplicated total. Office of Institutional Effectiveness and Research Page 1 Printed: 2/3/2012 1:55 PM Parts of Term= 1,7,A,R,S1,T1 Roane State Community College Enrollment Synopsis Spring 2012 FTE Breakdown Anderson Campbell FTE by Hours* Full Time Part Time FTE by Gender Male Female FTE by Class Level 1st Time Freshmen Other Freshmen Sophomore Pre-College Special Other Special FTE by Age 17 or Less 18 to 20 21 to 24 25 to 34 35 to 64 Over 64 Total FTE Cumberland Fentress Knox Loudon Morgan Roane Scott Total 528.33 741.93 45.00 116.67 112.33 202.80 4.80 59.13 47.67 101.33 12.13 79.20 5.87 36.47 624.87 860.27 36.87 108.87 2171.67 1552.87 418.07 852.20 61.27 100.40 112.07 203.07 16.13 53.60 36.33 106.87 29.80 61.53 20.00 22.33 508.73 976.40 58.00 87.73 1277.67 2446.87 56.93 436.13 672.87 54.40 49.93 12.07 82.53 50.73 15.13 1.20 30.53 125.60 129.67 27.73 1.60 2.87 14.60 10.80 24.20 1.60 3.80 77.47 28.60 49.00 10.40 39.87 19.93 20.00 1.13 1.80 15.93 7.93 16.47 0.20 56.27 496.73 839.27 33.13 59.73 9.53 47.33 47.73 39.73 1.40 182.00 1262.53 1856.40 259.40 164.20 47.27 510.27 242.13 264.67 205.67 0.27 13.87 91.93 22.13 20.00 13.73 31.87 144.47 55.60 49.33 33.07 0.80 17.40 20.67 4.20 5.53 4.67 22.47 23.93 33.27 50.67 30.13 16.80 45.60 10.27 11.60 7.07 13.27 22.67 0.53 2.73 2.13 1.00 32.47 616.20 283.73 328.80 223.13 0.80 29.80 65.00 13.67 22.20 14.67 0.40 225.20 1540.73 665.53 755.53 534.27 3.27 1270.27 161.67 315.13 52.47 160.47 91.33 42.33 1485.13 145.73 3724.53 *Note: Full time and part time FTE per campus includes only the FTE the student is taking at a particular campus. Therefore a student taking classes at mutliple campuses may be counted in the part time FTE in each campus breakdown, but full time in the FTE total. Office of Institutional Effectiveness and Research Page 2 Printed: 2/3/2012 1:55 PM Parts of Term= 1,7,A,R,S1,T1 Roane State Community College Enrollment Synopsis Spring 2012 Counties of Attendance County of Residence Anderson [001] Bledsoe [007] Blount [009] Bradley [011] Campbell [013] Carter [019] Cheatham [021] Claiborne [025] Clay [027] Cocke [029] Coffee [031] Cumberland [035] Davison [037] Dekalb [041] Dyer [045] Fayette [047] Fentress [049] Grainger [057] Greene [059] Hamblen [063] Hamilton [065] Hawkins [073] Jefferson [089] Knox [093] Loudon [105] McMinn [107] Macon [111] Marion [115] Meigs [121] Monroe [123] Montgomery [125 Morgan [129] Overton [133] Pickett [137] Polk [139] Putnam [141] Rhea [143] Roane [145] Robertson [147] Rutherford [149] Scott [151] Sequatchie [153] Sevier [155] Shelby [157] Sumner[165] Union [173] Warren [177] Washington [179] White [185] Williamson [187] Wilson [189] Out of State Foreign Totals Anderson Campbell Cumberland Fentress 971 1 81 1 182 19 328 5 8 2 14 9 1 Knox Loudon 40 1 73 7 Morgan 4 1 11 Roane 342 16 76 2 201 1 1 9 Undup Totals Scott 2 17 1 1 33 1 515 1 2 3 2 2 1 1 26 3 92 144 3 2 8 689 105 15 1 2 1 2 1 1 29 92 2 1 1 4 10 221 1 4 1 62 8 10 11 6 2 1 18 3 5 1 3 1 2 1 177 21 1 3 16 191 6 6 30 4 1 1 1 110 3 1 327 1 2 1 131 5 4 1 1 10 433 184 24 1 11 64 3 194 10 12 2 4 1 1 13 15 9 5 2 2 1 1 26 57 734 1 1 153 1 317 1 7 3 1 17 1 41 1 2 1 16 2 2 8 4 7 1 3 14 2619 1 383 Office of Institutional Effectiveness and Research 2 1 687 1 158 Page 3 373 1 275 131 1 8 16 3103 355 Printed: 2/3/2012 1:55 PM Parts of Term= 1,7,A,R,S1,T1 1128 23 212 3 518 1 1 15 1 3 1 670 2 2 1 1 261 8 1 8 1 2 16 1072 372 33 1 1 11 93 3 326 20 2 1 39 59 849 1 3 402 1 22 1 1 49 2 2 15 1 1 13 25 6300 Roane State Community College Enrollment Synopsis Spring 2012 Headcount & FTE Enrollment By Major MAJOR Computer Science Web Page Design Transfer Teaching Early Childhood Education Paralegal Studies General Transfer Professional Studies General Technology Police Science Homeland Security Geographic Info Sys Pre-Allied Health/Nursing Dental Hygiene Health Information Tech Medical Sec/Transc Occupational Therapy Pharmacy Technician Physical Therapy Asst EMT - Paramedic Radiologic Technology Respiratory Therapy Polysomnography Tech Diagnosis & Proc Coding Opticianry Environmental Health Massage Therapy Nursing Allied Health Science Bus Management Tech Contemporary Mgmt Special Students TBR Code 0611010100 0611080100 0813010100 1219070600 1422030200 1624010101 1624010202 2332011100 2743010700 2743999900 2845070200 3151000000 3151060200 3151070700 3151070800 3151080300 3151080500 3151080600 3151090400 3151090700 3151090800 3151091700 3151099901 3151180100 3151220200 3151350100 3151380100 3151999901 3252020101 3252029901 N Total Headcount and FTE Office of Institutional Effectiveness and Research First-Time Freshmen Headcount FTE Other Freshmen Headcount FTE Sophmores Headcount FTE 1 4 6 4 61 1 13 22 0.60 2.93 3.73 2.13 45.47 0.20 7.40 14.93 3 63 47 20 588 6 40 96 2.47 50.80 30.60 14.60 445.73 3.60 25.13 66.80 4 163 55 29 881 14 65 108 3.00 119.33 38.13 19.00 619.33 7.13 38.80 77.47 3 115 1 0 2.60 74.67 0.80 0.00 5 753 0 1 3.07 466.27 0.00 0.40 10 761 24 43 6.73 415.87 18.40 30.73 0 0 0 0.00 0.00 0.00 5 0 4 3.47 0.00 2.93 41 0 23 31.33 0.00 24.53 0 0 0.00 0.00 7 0 5.53 0.00 70 31 55.40 21.93 0 1 0.00 0.40 1 23 0.93 16.67 36 43 31.60 28.07 0 16 23 1 0.00 11.33 14.00 0.80 1 49 122 22 0.87 32.53 80.60 9.53 223 54 160 30 122.87 31.07 103.33 12.33 272 182.00 1856 Page 4 1262.53 2868 1856.40 Undergrad Special Headcount FTE 8 4.33 0 0.00 1 8 0.20 3.20 21 14.93 14 13.60 25 21.53 27 19 19.07 9.93 11 9.40 1170 327.40 1304 423.60 Printed: 2/3/2012 1:55 PM Parts of Term= 1,7,A,R,S1,T1
