Attachment D 4-year university, 2-year college, technical college Year 5... System: University of Louisiana System
advertisement
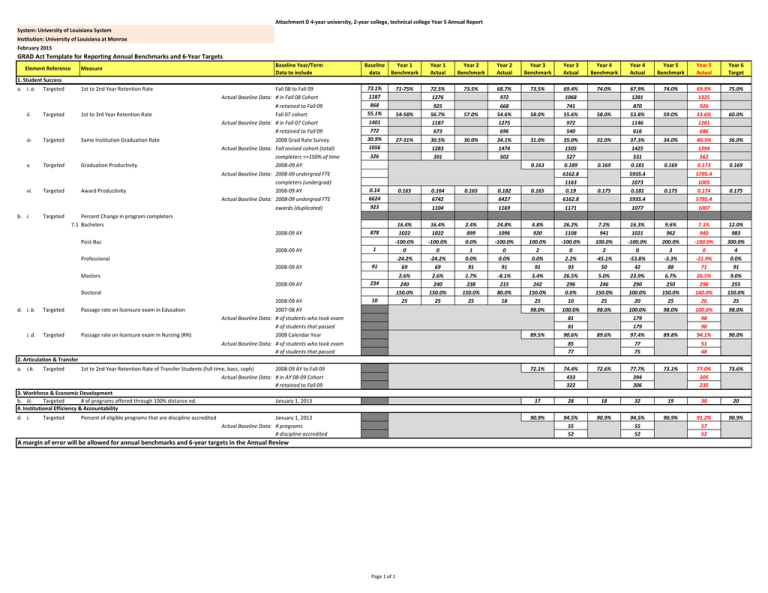
Attachment D 4-year university, 2-year college, technical college Year 5 Annual Report System: University of Louisiana System Institution: University of Louisiana at Monroe February 2015 GRAD Act Template for Reporting Annual Benchmarks and 6-Year Targets Element Reference Measure Baseline Year/Term Data to include Baseline data Year 1 Benchmark Year 1 Actual Year 2 Benchmark Year 2 Actual Year 3 Benchmark Year 3 Actual Year 4 Benchmark Year 4 Actual Year 5 Benchmark Year 5 Actual Year 6 Target 73.1% 1187 868 55.1% 1401 772 30.9% 1056 326 71-75% 72.5% 1276 925 56.7% 1187 673 30.5% 1283 391 73.5% 68.7% 972 668 54.6% 1275 696 34.1% 1474 502 73.5% 69.4% 1068 741 55.6% 972 540 35.0% 1505 527 0.189 6162.8 1163 0.19 6162.8 1171 74.0% 67.9% 1281 870 53.8% 1146 616 37.3% 1425 531 0.181 5935.4 1073 0.181 5935.4 1077 74.0% 69.9% 1325 926 53.6% 1281 686 40.3% 1394 562 0.173 5795.4 1005 0.174 5795.4 1007 75.0% 26.2% 1108 -100.0% 0 2.2% 93 26.5% 296 0.0% 10 100.0% 81 81 90.6% 85 77 7.2% 941 100.0% 2 -45.1% 50 5.0% 246 150.0% 25 98.0% 16.3% 1021 -100.0% 0 -53.8% 42 23.9% 290 100.0% 20 100.0% 179 179 97.4% 77 75 9.6% 962 200.0% 3 -3.3% 88 6.7% 250 150.0% 25 98.0% 7.1% 940 -100.0% 0 -21.9% 71 26.5% 296 160.0% 26 100.0% 98 98 94.1% 51 48 12.0% 983 300.0% 4 0.0% 91 9.0% 255 150.0% 25 98.0% 1. Student Success a. i. a. Targeted 1st to 2nd Year Retention Rate ii. Targeted 1st to 3rd Year Retention Rate iv. Targeted Same Institution Graduation Rate v. Targeted Graduation Productivity vi. Targeted Award Productivity b. i. Targeted Fall 08 to Fall 09 Actual Baseline Data: # in Fall 08 Cohort # retained to Fall 09 Fall 07 cohort Actual Baseline Data: # in Fall 07 Cohort # retained to Fall 09 2008 Grad Rate Survey Actual Baseline Data: Fall revised cohort (total) completers <=150% of time 2008-09 AY Actual Baseline Data: 2008-09 undergrad FTE completers (undergrad) 2008-09 AY Actual Baseline Data: 2008-09 undergrad FTE awards (duplicated) 0.14 6624 923 2008-09 AY 878 2008-09 AY 1 2008-09 AY 91 2008-09 AY 234 Post-Bac Professional Masters Doctoral Targeted Passage rate on licensure exam in Education i. d. Targeted Passage rate on licensure exam in Nursing (RN) 2008-09 AY 2007-08 AY Actual Baseline Data: # of students who took exam # of students that passed 2008 Calendar Year Actual Baseline Data: # of students who took exam # of students that passed 27-31% 57.0% 30.0% 58.0% 31.0% 0.163 Percent Change in program completers 7.1 Bachelors d. i. b. 54-58% 10 0.165 0.164 6742 1104 0.165 0.182 6427 1169 0.165 16.4% 1022 -100.0% 0 -24.2% 69 2.6% 240 150.0% 25 16.4% 1022 -100.0% 0 -24.2% 69 2.6% 240 150.0% 25 2.4% 899 0.0% 1 0.0% 91 1.7% 238 150.0% 25 24.8% 1096 -100.0% 0 0.0% 91 -8.1% 215 80.0% 18 4.8% 920 100.0% 2 0.0% 91 3.4% 242 150.0% 25 98.0% 89.5% 58.0% 32.0% 0.169 0.175 89.6% 59.0% 34.0% 0.169 0.175 89.8% 60.0% 36.0% 0.169 0.175 90.0% 2. Articulation & Transfer a. i.b. Targeted 1st to 2nd Year Retention Rate of Transfer Students (full time, bacc, soph) 2008-09 AY to Fall 09 Actual Baseline Data: # in AY 08-09 Cohort # retained to Fall 09 3. Workforce & Economic Development b. iii. Targeted # of programs offered through 100% distance ed. January 1, 2013 4. Institutional Efficiency & Accountability 72.1% 74.4% 433 322 72.6% 77.7% 394 306 73.1% 77.0% 305 235 73.6% 17 28 18 32 19 38 20 d. i. 90.9% 94.5% 55 52 90.9% 94.5% 55 52 90.9% 91.2% 57 52 90.9% Targeted Percent of eligible programs that are discipline accredited January 1, 2013 Actual Baseline Data: # programs # discipline accredited A margin of error will be allowed for annual benchmarks and 6-year targets in the Annual Review Page 1 of 1
