Bedform characterization in river channel through 2D spectral analysis
advertisement
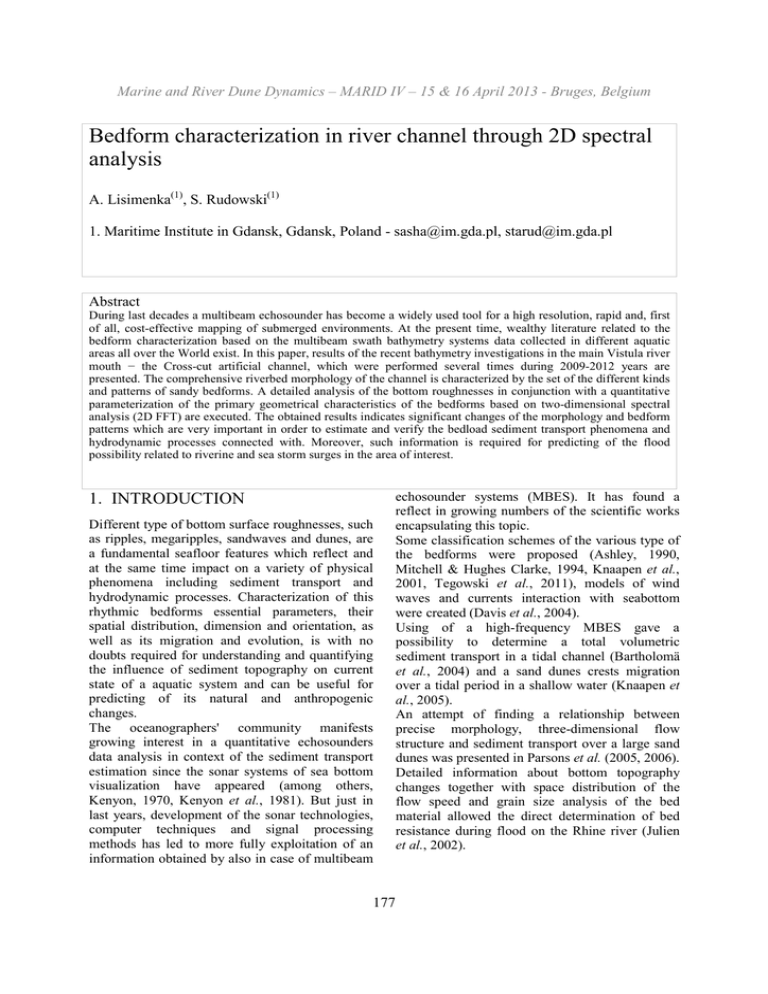
Marine and River Dune Dynamics – MARID IV – 15 & 16 April 2013 - Bruges, Belgium Bedform characterization in river channel through 2D spectral analysis A. Lisimenka(1), S. Rudowski(1) 1. Maritime Institute in Gdansk, Gdansk, Poland - sasha@im.gda.pl, starud@im.gda.pl Abstract During last decades a multibeam echosounder has become a widely used tool for a high resolution, rapid and, first of all, cost-effective mapping of submerged environments. At the present time, wealthy literature related to the bedform characterization based on the multibeam swath bathymetry systems data collected in different aquatic areas all over the World exist. In this paper, results of the recent bathymetry investigations in the main Vistula river mouth − the Cross-cut artificial channel, which were performed several times during 2009-2012 years are presented. The comprehensive riverbed morphology of the channel is characterized by the set of the different kinds and patterns of sandy bedforms. A detailed analysis of the bottom roughnesses in conjunction with a quantitative parameterization of the primary geometrical characteristics of the bedforms based on two-dimensional spectral analysis (2D FFT) are executed. The obtained results indicates significant changes of the morphology and bedform patterns which are very important in order to estimate and verify the bedload sediment transport phenomena and hydrodynamic processes connected with. Moreover, such information is required for predicting of the flood possibility related to riverine and sea storm surges in the area of interest. 1. INTRODUCTION Different type of bottom surface roughnesses, such as ripples, megaripples, sandwaves and dunes, are a fundamental seafloor features which reflect and at the same time impact on a variety of physical phenomena including sediment transport and hydrodynamic processes. Characterization of this rhythmic bedforms essential parameters, their spatial distribution, dimension and orientation, as well as its migration and evolution, is with no doubts required for understanding and quantifying the influence of sediment topography on current state of a aquatic system and can be useful for predicting of its natural and anthropogenic changes. The oceanographers' community manifests growing interest in a quantitative echosounders data analysis in context of the sediment transport estimation since the sonar systems of sea bottom visualization have appeared (among others, Kenyon, 1970, Kenyon et al., 1981). But just in last years, development of the sonar technologies, computer techniques and signal processing methods has led to more fully exploitation of an information obtained by also in case of multibeam 177 echosounder systems (MBES). It has found a reflect in growing numbers of the scientific works encapsulating this topic. Some classification schemes of the various type of the bedforms were proposed (Ashley, 1990, Mitchell & Hughes Clarke, 1994, Knaapen et al., 2001, Tegowski et al., 2011), models of wind waves and currents interaction with seabottom were created (Davis et al., 2004). Using of a high-frequency MBES gave a possibility to determine a total volumetric sediment transport in a tidal channel (Bartholomä et al., 2004) and a sand dunes crests migration over a tidal period in a shallow water (Knaapen et al., 2005). An attempt of finding a relationship between precise morphology, three-dimensional flow structure and sediment transport over a large sand dunes was presented in Parsons et al. (2005, 2006). Detailed information about bottom topography changes together with space distribution of the flow speed and grain size analysis of the bed material allowed the direct determination of bed resistance during flood on the Rhine river (Julien et al., 2002). Marine and River Dune Dynamics – MARID IV – 15 & 16 April 2013 - Bruges, Belgium High variability of the main bedform structures parameters in space and in time requires an appropriate mathematic tool for its determination. In context of scientific problem presented in this paper, results of works of many investigators based on algorithms of two-dimensional Fast Fourier Transform (2D FFT) spectral analysis have indicated a possibility of detailed quantification of the primary bedforms characteristics, determine their space form and dominant surface roughnesses (among others, Percival & Walden, 1993, Lyons et al., 2002, Briggs et al., 2005, Cazenave et al., 2008, Lefebvre et al., 2011, Lefebvre & Lyons, 2011), what is a main term for verification of the bedload sediment transport and hydrodynamic processes connected with. 2. MEASUREMENT AREA Investigations were carried out in the main Vistula river mouth located in Polish coastal waters (Fig. 1). The Vistula is the longest river in Poland and plays a dominant role as regards both the catchment area size and the amount of discharged water flowing into the Gulf of Gdansk. Generally, a hydrological conditions in the main Vistula river mouth area, where a river waters mix with sea waters from the Gulf of Gdansk, are formed through interaction of the processes from this two environments. This riverine and marine processes influence superbly on not only current hydrological regime in the area, but seriosly affect on the morphology evolution of this part of the river, coast and neighbouring marine waters in longterm period of time. Scale of the hydrological conditions related to the magnitude and variation of the water flows during 2009-2012 hydrological years is presented in Fig.2. Average daily water discharge data1 were obtained from the gauging section located in Tczew, in range of 31.2km upstream the Vistula channel mouth. This gauging section is the last representative place situated in the lower reach of the Vistula river, which covers 99,92% of the catchment area (Augustowski, 1982), and, moreover, is not subjected to the impact of the backwater phenomena connected with the sea storm surge (mainly occurs when strong winds blow from north and west directions during long period of time). ° 6000 3 Water Discharge [ m /s ] 55.0 N B a l t i c S e a 2009 2010 5000 2011 4000 2012 3000 2000 1000 Gulf of Gdansk XI ° 54.5 N XII I II III IV V VI VII VIII IX X Month Figure 2. Average daily water discharge during 2009-2012 hydrological years. Measurement area POLAND ° 18.5 E 19.0° E 19.5° E Figure 1. Location of the measurement area. The main Vistula river mouth is the Cross-cut artificial channel with a ca 3000m length, 400m width and up to 10m depth. More than 95% of total Vistula waters outflow into the sea through this channel with the average annual water discharge more than 1000m3/s (Cyberski, 1997). 178 In period of time between two measurement campaigns (see Section 3.1), a considerable variations in water discharge were taken place. Several phenomena with extremely high magnitudes connected with a precipitation floods (up to 6360m3/s in May 2011) and a snow-melt floods (up to 4000m3/s in January 2011) were observed and with no doubts have significantly 1 hydrological data source − internet information service of the Institute of Meteorology and Water Management, www.pogodynka.pl Marine and River Dune Dynamics – MARID IV – 15 & 16 April 2013 - Bruges, Belgium influenced on morphological character of the bottom as well as sediment mass transport in the area of interest. 3. 3.1. METHODS Data acquisition Bathymetry measurements were carried out several times in 2009-2012 years on the board of the hydrographic boat Imoros 2. In the paper, results of two measurement campaigns which were performed in 20-23 August 2009 and 4-6 June 2012 are presented. An area of the interest was mapped using boat mounted high-resolution Reson Seabat 8101 (before 2012 year) and 7101 multibeam echosounder systems (MBES). The positioning system DGPS RTK Trimble SPS 851 together with Ixsea Hydrins inertial navigation system were integrated with MBES using the QINSy data acquisition software package. During of the each hydroacoustic surveys, the vertical sound speed profiles were measured using the portable model Reson Sound Velocity Probe SVP15. 3.2. Postprocessing The bathymetric data were gridded with a cell size of 0.25m. The whole dataset was subsequently divided into the sub-domains using by a sliding square windows of 50m side with a 75% overlapping between an adjacent windows. Within a particular window, the mean depth was subtracted from each data sample and then a detrending procedure was applied. In order to minimize the spectral leakage due to the finite length of the data set, the data in each window were pre-multiplying by single orthogonal taper belongs to a family of functions known as discrete prolate spheroidal sequences (DPSS). Next, the spectral analysis based on the 2D Fast Fourier Transform (2D FFT) algorithm was executed: S( fx , f y ) = +∞+∞ ∫ ∫ s ( x, y ) e − 2πi ( f x x + f y y ) dxdy (1) − ∞− ∞ where s(x,y) = spatial signal in the x and y directions, S(fx, fy) = two-dimensional amplitude spectrum referred to the appropriate spatial frequencies fx and fy. In order to exclude appearance of false components in spectra associated with the border of the data coverage effect, the 2D FFT was 179 calculated only in sub-domains with a full data coverage (completely wet areas). Then, the power spectrum density was calculated and direction and spatial frequency of the most energetic peak were determined. As it was also noted in Lefebvre et al. (2011), although the data were detrended before being spectrally transformed, low frequency components were still present and masked the higher frequencies that are of interest. So, frequencies corresponding to wavlengths larger than 25m (half a square window geometrical dimension) were filtered out. 4. RESULTS The comprehensive morphological character of the bottom is presented (Fig.3). The bottom relief are consist of two biggest forms: sand bar and trough, located along the border of the channel. In August 2009 (Fig. 3a), this main forms occupied almost all of the channel area. But at the end part, the trough is closed by the sandbar and nearly filled the channel mouth, in spite of the left side where an erosional depression is situated. In June 2012 (Fig. 3b), there are significant changes in bottom morphology. The sandbar is become longer, completely covered the erosional depression. By another hand, the trough end is become good formed completely opened the mouth. Moreover, a set of the different bedforms as sandwaves with superimposed megaripples and ripples with various height, wavelength and orientation are observed. The calculated bedform orientation and wavelength based on the results of the twodimensional spectral analysis in particular square windows, depicted by black vectors and superimposed on the part of the appropriate bottom relief (depicted by dashed rectangulars in Fig.3) are shown in more detailed scale in Fig.4. The different pattern of the bedform crests and significant changes of the their spatial frequency and orienation as well as distribution are distinctly visible. 5. CONCLUSIONS The obtained results indicates that the application of the 2D spectral analysis is a good tool for Marine and River Dune Dynamics – MARID IV – 15 & 16 April 2013 - Bruges, Belgium studies of the bedload sediment transport phenomena, roughnesses character of the bottom and hydrodynamic processes connected with. It should be require for monitoring, modeling and prognosis of the bedload transport and flows, especially related to flood possibility (riverine and/or sea storm surge). The data are also needed to prepare an emergency warning against extreme hydrological conditions for local society by appropriate services. 6. ACKNOWLEDGMENT The author is grateful to the National Centre for Research and Development for funding this work by grant No PBS1/A2/3/2012. 7. REFERENCES Ashley, G. M. 1990. Classification of large-scale subaqueous bedforms; a new look at and old problem. J. Sediment. Res. 60(1): 161-172. Augustowski, B. (ed.). 1982. Dolina dolnej Wisły. Ossolineum, Wrocław (in polish). Bartholomä, A. & Ernstsen, V.B. & Flemming, B.W. & Bartholdy, J. 2004. Bedform dynamics and net sediment transport paths over a flood-ebb tidal cycle in the Grådyb channel (Denmark), determined by high-resolution multibeam echosounding. Danish J. of Geography 104(1): 4555. Briggs, K.B. & Lyons, A.P. & Pouliquen, E. & Mayer, L.A. & Richardson, M.D. 2005. Seafloor roughness, sediment grain size and temporal variability. Proc. of Intern. Conf. and Exchib. on UAM, Heraklion, Crete, Greece, pp. 29-37. Cazenave, P. W. & Lambkin, D.O. & Dix, J.K. 2008. Quantitative bedform analysis using decimetre resolution swath bathymetry. Caris 2008 Conference Proc., 22-26.09.2008, Bath, UK, 12 p. Cyberski, J. 1997. Riverine outflow into the Gulf of Gdańsk. Oceanol. Stud. 26(4): 65–75. Davis, J.P. & Walker, D.J. & Townsend, M. & Young, I.R. 2004. Wave-formed sediment ripples: Transient analysis of ripple spectral development. J. Geoph. Res. 109 (C07020): 15 pp. doi:10.1029/2004JC002307 Julien, P. Y. & Asce, M. & Klaassen, G. J. & Ten Brinke, W. B. M. & Wilbers, A. W. E. 2002. Case 180 Study: Bed Resistance of Rhine River during 1998 Flood. J. Hydraul. Eng. 128: 1042-1050. Kenyon, N.H. 1970. Sand ribbons of European tidal seas. Marine Geology 9: 25-39. Kenyon, N.H. & Belderson, R.H. & Stride, A.H. & Johnson, M.A. 1981. Offshore tidal sand banks as indicators of net sand transport and as potential deposits. Spec. Public. of the Intern. Assoc. of Sedimentologists. 5: 257-268. Knaapen, M.A.F. & Hulscher, S.J.M.H. & de Vriend, H.J. 2001. A new type of sea bed waves. Geophysical Research Letters 28(7): 1323-1326. Knaapen, M.A.F. & van Bergen Henegouw, C.N. & Hu, Y.Y. 2005. Quantifying bedforms migration using multi-beam sonar. Geo-Marine Letters 25: 306-314. Lefebvre, A. & Ernstsen, V.B. & Winter, C. 2011. Bedform characterization through 2D spectral analysis. J. Coast. Res. Spec. Issue 57: 781-785. Lefebvre, A. & Lyons, A.P. 2011 Quantification of roughness for seabed characterization. Proc. of 4th Intern. Conf. and Exhib. on UAM, Kos Island, Greece, 20-24 June 2011, 8 p. Lyons, A.P. & Fox, W.L.J. & Hasiotis, T. & Pouliquen E. 2002. Characterization of the two-dimensional roughness of wave-rippled sea floors using digital photogrammetry. IEEE J. Ocean. Eng. 27(3): 515524. Mitchell, N.C. & Hughes Clarke, J.E. 1994. Classification of seafloor geology using multibeam sonar data from the scotian shelf. Marine Geology. 121: 143-160. Parsons, D. R. & Best, J. L. & Orfeo, O. & Hardy, R. J. & Kostaschuk, R. & Lane, S. N. 2005. Morphology and flow fields of three-dimensional dunes, Rio Paraná, Argentina: Results from simultaneous multibeam echosounding and acoustic Doppler current profiling. J. Geophys. Res. 110 (F04S03): 9 pp. Parsons, D. R. & Best, J. L. & Lane, S. N. & Hardy, R. J. & Kostaschuk, R. & Shugar, D. & Orfeo, O. 2006. Morphology, flow and sediment transport over a natural 3D dune field: Rio Paraná, Argentina. River Flow 2006 vols 1 and 2: 9971004. Percival, D.B. & Walden, A.T. 1993. Spectral analysis for physical application. Cambridge University Press, 616 p. Tegowski, J. & Nowak, J. & Moskalik, M. & Szefler, K. 2011. Seabed classification from multibeam echosounder backscatter data using wavelet transformation and neural network approach. Proc. of 4th Intern. Conf. and Exhib. on UAM, Kos Island, Greece, 20-24 June 2011, 1257-1264. Marine and River Dune Dynamics – MARID IV – 15 & 16 April 2013 - Bruges, Belgium (a) (b) Figure 3. Bathymetry images of the Vistula river channel on the base of measurements performed in August 2009 (a) and June 2012 (b). Coordinates in WGS-84. Colorbar scales in meters. (a) (b) Figure 4. Calculated bedform orientation and wavelength depicted in the black vectors superimposed on the bottom relief of the river channel (part of the Fig.3 in bigger scale) for August 2009 (a) and June 2012 (b) respectively. Length of the black vectors is proportional on bedform wavelength. Coordinates in WGS-84. Colorbar scales in meters. 181
