Methodist University - Reeves School of Business
advertisement
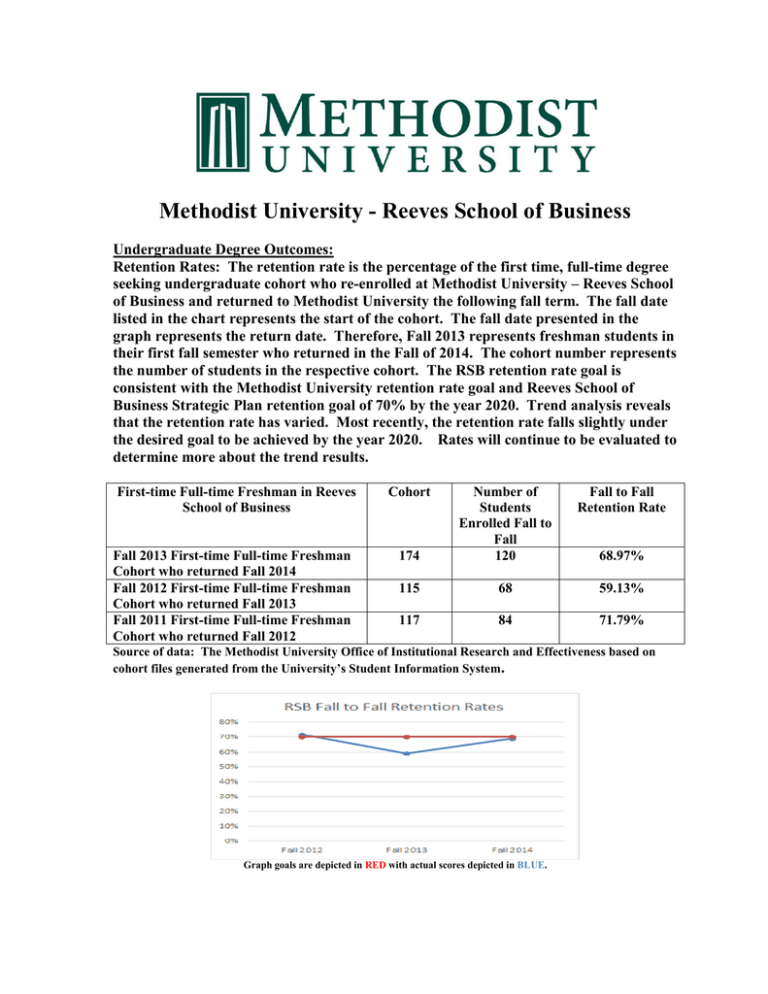
Methodist University - Reeves School of Business Undergraduate Degree Outcomes: Retention Rates: The retention rate is the percentage of the first time, full-time degree seeking undergraduate cohort who re-enrolled at Methodist University – Reeves School of Business and returned to Methodist University the following fall term. The fall date listed in the chart represents the start of the cohort. The fall date presented in the graph represents the return date. Therefore, Fall 2013 represents freshman students in their first fall semester who returned in the Fall of 2014. The cohort number represents the number of students in the respective cohort. The RSB retention rate goal is consistent with the Methodist University retention rate goal and Reeves School of Business Strategic Plan retention goal of 70% by the year 2020. Trend analysis reveals that the retention rate has varied. Most recently, the retention rate falls slightly under the desired goal to be achieved by the year 2020. Rates will continue to be evaluated to determine more about the trend results. First-time Full-time Freshman in Reeves School of Business Fall 2013 First-time Full-time Freshman Cohort who returned Fall 2014 Fall 2012 First-time Full-time Freshman Cohort who returned Fall 2013 Fall 2011 First-time Full-time Freshman Cohort who returned Fall 2012 Cohort Fall to Fall Retention Rate 174 Number of Students Enrolled Fall to Fall 120 115 68 59.13% 117 84 71.79% 68.97% Source of data: The Methodist University Office of Institutional Research and Effectiveness based on cohort files generated from the University’s Student Information System. Graph goals are depicted in RED with actual scores depicted in BLUE. Graduation Rates: The graduation rate is the percentage of the first time, full-time degree seeking undergraduate freshman cohort at Methodist University – Reeves School of Business who graduated in six years at Methodist University. The fall date listed in the chart is for the start of the cohort. Therefore, Fall 2008 represents freshman students in their first fall semester who graduated in 2014, which is six years later. The cohort number represents the number of students in the respective cohort. The goal for the RSB 6-year graduation rate is consistent with the Methodist University 6-year graduation rate goal of 55% by the year 2020. Trend analysis reveals that the 6year graduation rate has been below the desired goal to be achieved by the year 2020. Rates will continue to be evaluated to determine more about the trend results. First-time Full-time Freshman in Reeves School of Business Fall 2008 First-time Full-time Freshman Cohort who graduated in 2014 Fall 2007 First-time Full-time Freshman Cohort who graduated in 2013 Fall 2006 First-time Full-time Freshman Cohort who graduated in 2012 Cohort 150 Graduated in 6-Years 68 6-Year Graduation Rate 45.33% 171 81 47.37% 172 74 43.02% Source of data: The Methodist University Office of Institutional Research and Effectiveness based on cohort files generated from the University’s Student Information System. Graph goals are depicted in RED with actual scores depicted in BLUE.
