Math 2210-5 Extra Credit An Application of the Dot Product from Genetics
advertisement

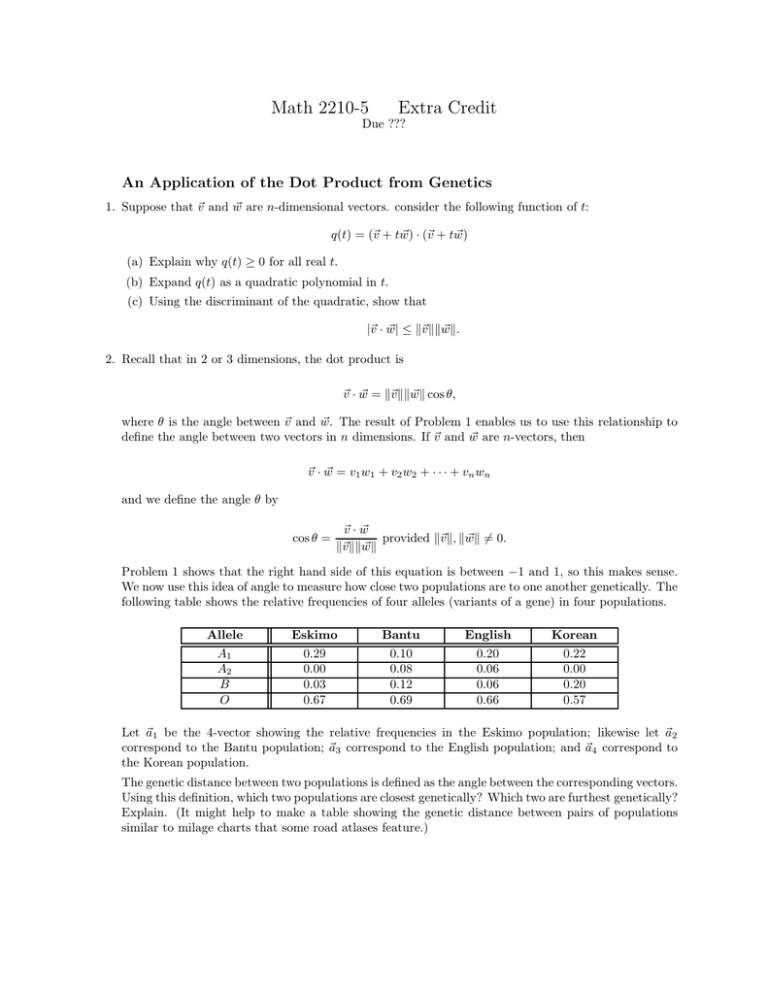
Math 2210-5 Extra Credit Due ??? An Application of the Dot Product from Genetics 1. Suppose that ~v and w ~ are n-dimensional vectors. consider the following function of t: q(t) = (~v + tw) ~ · (~v + tw) ~ (a) Explain why q(t) ≥ 0 for all real t. (b) Expand q(t) as a quadratic polynomial in t. (c) Using the discriminant of the quadratic, show that |~v · w| ~ ≤ k~v kkwk. ~ 2. Recall that in 2 or 3 dimensions, the dot product is ~v · w ~ = k~v kkwk ~ cos θ, where θ is the angle between ~v and w. ~ The result of Problem 1 enables us to use this relationship to define the angle between two vectors in n dimensions. If ~v and w ~ are n-vectors, then ~v · w ~ = v1 w1 + v2 w2 + · · · + vn wn and we define the angle θ by cos θ = ~v · w ~ provided k~vk, kwk ~ 6= 0. k~vkkwk ~ Problem 1 shows that the right hand side of this equation is between −1 and 1, so this makes sense. We now use this idea of angle to measure how close two populations are to one another genetically. The following table shows the relative frequencies of four alleles (variants of a gene) in four populations. Allele A1 A2 B O Eskimo 0.29 0.00 0.03 0.67 Bantu 0.10 0.08 0.12 0.69 English 0.20 0.06 0.06 0.66 Korean 0.22 0.00 0.20 0.57 Let ~a1 be the 4-vector showing the relative frequencies in the Eskimo population; likewise let ~a2 correspond to the Bantu population; ~a3 correspond to the English population; and ~a4 correspond to the Korean population. The genetic distance between two populations is defined as the angle between the corresponding vectors. Using this definition, which two populations are closest genetically? Which two are furthest genetically? Explain. (It might help to make a table showing the genetic distance between pairs of populations similar to milage charts that some road atlases feature.)


