Math 5110 - Fall 2012 Homework Problem Set 2
advertisement
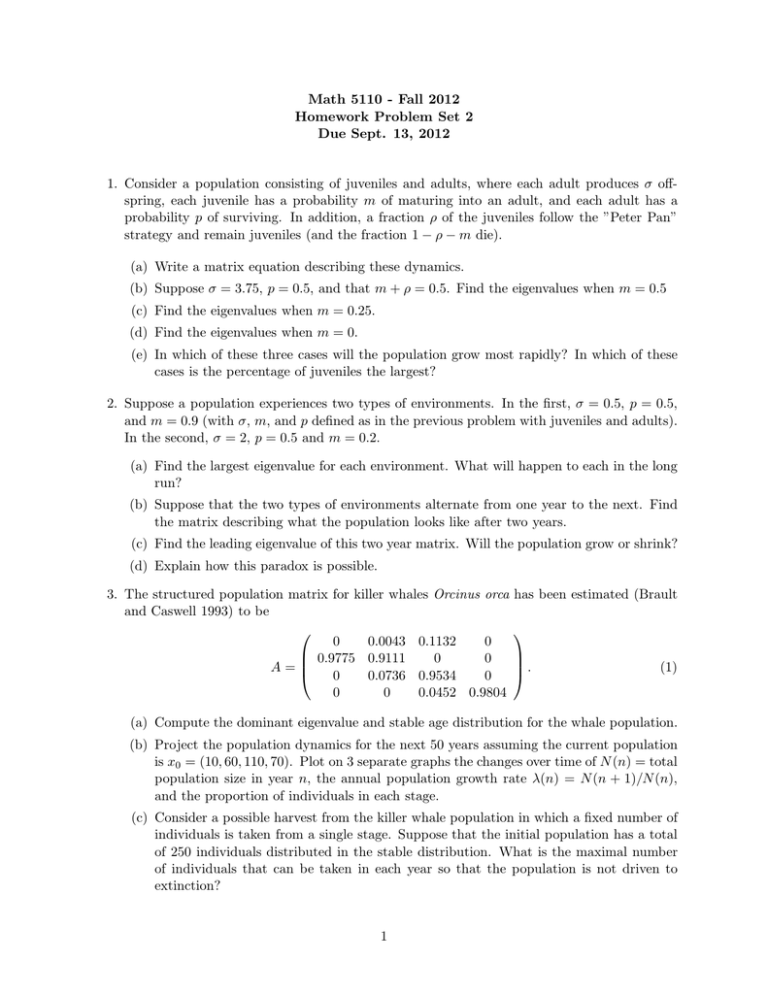
Math 5110 - Fall 2012 Homework Problem Set 2 Due Sept. 13, 2012 1. Consider a population consisting of juveniles and adults, where each adult produces σ offspring, each juvenile has a probability m of maturing into an adult, and each adult has a probability p of surviving. In addition, a fraction ρ of the juveniles follow the ”Peter Pan” strategy and remain juveniles (and the fraction 1 − ρ − m die). (a) Write a matrix equation describing these dynamics. (b) Suppose σ = 3.75, p = 0.5, and that m + ρ = 0.5. Find the eigenvalues when m = 0.5 (c) Find the eigenvalues when m = 0.25. (d) Find the eigenvalues when m = 0. (e) In which of these three cases will the population grow most rapidly? In which of these cases is the percentage of juveniles the largest? 2. Suppose a population experiences two types of environments. In the first, σ = 0.5, p = 0.5, and m = 0.9 (with σ, m, and p defined as in the previous problem with juveniles and adults). In the second, σ = 2, p = 0.5 and m = 0.2. (a) Find the largest eigenvalue for each environment. What will happen to each in the long run? (b) Suppose that the two types of environments alternate from one year to the next. Find the matrix describing what the population looks like after two years. (c) Find the leading eigenvalue of this two year matrix. Will the population grow or shrink? (d) Explain how this paradox is possible. 3. The structured population matrix for killer whales Orcinus orca and Caswell 1993) to be 0 0.0043 0.1132 0 0.9775 0.9111 0 0 A= 0 0.0736 0.9534 0 0 0 0.0452 0.9804 has been estimated (Brault . (1) (a) Compute the dominant eigenvalue and stable age distribution for the whale population. (b) Project the population dynamics for the next 50 years assuming the current population is x0 = (10, 60, 110, 70). Plot on 3 separate graphs the changes over time of N (n) = total population size in year n, the annual population growth rate λ(n) = N (n + 1)/N (n), and the proportion of individuals in each stage. (c) Consider a possible harvest from the killer whale population in which a fixed number of individuals is taken from a single stage. Suppose that the initial population has a total of 250 individuals distributed in the stable distribution. What is the maximal number of individuals that can be taken in each year so that the population is not driven to extinction? 1 4. Loggerhead sea turtles Caretta caretta are listed as threatened under the US Endangered Species Act. A five-class structured model for their population size has been estimated (Crowder et al. 1994) with 0 0 0 4.655 61.896 0.675 0.703 0 0 0 . A= 0 0.047 0.657 0 0 (2) 0 0 0.019 0.682 0 0 0 0 0.061 0.8091 (a) Determine the growth rate and stable age distribution for this population. (b) Determine the elasticity of this matrix. (c) There are two possible strategies for improving the survival for these turtles. One could try to improve the surviviorship of eggs and nestlings (age class 1) by protecting nests on beaches, or try to improve the survivoship of the juvenile and adult classes by using improved fishing nets that release trapped turtles. Explore which of these strategies is better. How is the population survival affected by a change in the class 1 survivorship probability, compared to a similar percentage change in class 2-5 survivorship probabilities? 2
