Calculus I Practice Problems 8: Answers y 2
advertisement
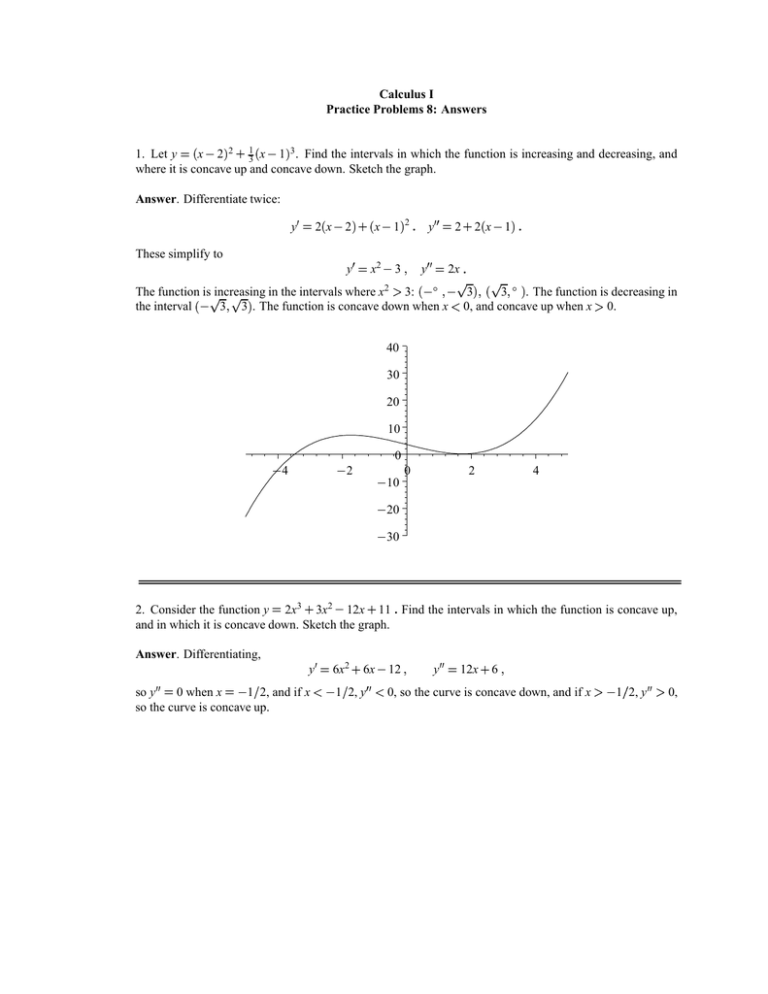
Calculus I Practice Problems 8: Answers 1. Let y x 2 2 13 x 1 3 . Find the intervals in which the function is increasing and decreasing, and where it is concave up and concave down. Sketch the graph. Answer. Differentiate twice: y 2 x 2 2 x 1 y 2 2 x 1 These simplify to y x2 3 y 2x The function is increasing in the intervals where x2 3: ∞ 3 3 ∞ . The function is decreasing in the interval 3 3 . The function is concave down when x 0, and concave up when x 0. 40 PSfrag replacements 30 20 10 0 4 2 0 10 20 30 2 4 2. Consider the function y 2x3 3x2 12x 11 Find the intervals in which the function is concave up, and in which it is concave down. Sketch the graph. Answer. Differentiating, y so y 0 when x 1 2, and if x so the curve is concave up. 6x2 6x 12 1 2, y y 12x 6 0, so the curve is concave down, and if x 1 2, y 0, PSfrag replacements 150 100 50 5 4 3 2 0 1 1 0 2 3 4 50 100 150 3. For the following function, find a) all critical values, b) intervals in which the function is increasing and where it is decreasing, c) intervals in which the function is concave up or concave down: x4 4x3 4x2 2 g x Sketch the graph. Answer. Differentiate twice: 4x3 12x2 8x g x g x 4x x 1 x 2 12x2 24x 8 a. The critical values are x 0 1 2. b. Check the sign of g between the critical values. The function is decreasing for x 0, then increases in 0 x 1, decreases in 1 x 2 and is increasing for x 2. c. The equation g x 0 has the solutions α 1 1 3 β 1 1 3 . Check the sign of g between those points: g is concave up for x α and x β , and concave down for α x β . PSfrag replacements 10 8 6 2 4 2 1 05 0 0 05 1 15 2 25 3 4. Consider the function 1 5 4 x 2x2 3x3 defined for x 0. a) Find the intervals in which the function is increasing, and the intervals in which it is decreasing. b) Find the intervals in which the function is concave up, concave down. Sketch the graph. y Answer. First we write the function in exponential notation: 1 x y 5 x 2 4 x 3 2 3 a) Differentiating: y 2 x 5x 3 4x 4 4 x x2 5x 4 x 4 x 1 x 4 Thus, if 0 x 1, we have y 0, so the function is decreasing; if 1 x 4, we have y 0, so the function is increasing; if x 4, we have y 0, so the function is decreasing. b) Now we find the second derivative by differentiating y (choose the first expression above; it is the easiest): y 3 2x 4 15x 5 16x x 5 2x2 15x 16 The roots of the quadratic expression give the points of inflection: 15 x 225 128 4 15 9 85 4 1 288 6 1212 So, y x 5 x α x β where α β are these two roots, and y 0 for 0 x α x β , and the graph is concave up in these intervals; y 0 for α x β , so the graph is concave down in that interval. 1 PSfrag replacements 0 5 01 15 0 1 2 3 4 f x sin x 5 6 7 8 20 55 35 1 5. Consider the function cosx 2 as defined on the interval π π . Find a) all critical values, b) all points of inflection, c) the value at which the function takes its maximum. Sketch the graph. Answer. Differentiate: f x f x cos x 2 cosx sin x sin x 1 2 sinx cos x 1 2 sinx 2 cos2 x 4 sin2 x sinx 2 (I have used the identity cos2 x 1 sin2 x . a) and c). The critical values occure where cos x 0 or sin x 1 2. The first gives the two values x π 2 π 2 and the second gives the values x π 6 5π 6. Since y 1 at the first two values, and y 3 2 at the second, the first two are local minima, and the second two are local maxima. b). The solutions to the quadratic equation y 0 are 1 sin x 33 8 The first gives the values x of inflection. PSfrag replacements 635 5931 and 1 sin x 33 8431 8 2 51, and the second the values x 1 003 2 134. These are the points 1 5 15 1 0 5 1 0 −3 2 1 0 25 1 x2 1 3 05 35 4 6. Let y 2 1 1 Find the x coordinate of the points of inflection of the curve so defined. Sketch the graph. Answer. Differentiating: y y 2x x2 1 2 , and 2 x2 1 2 2x 2 x2 1 2x x2 1 4 6x2 2 x2 1 3 so the points of inflection are at x 1 3. Notice that the graph is increasing for x 0, and decreasing for x 0, and approaches 0 asymptotically both to the left and the right. 2 PSfrag replacements 1 5 1 1 2 0 5 3 0 2 1 1 0 2 3 In each of the following, derive enough information about the curve to sketch the graph, showing clearly all asymptotes. x x2 1 7. y Answer. The function is negative for x x ∞. Differentiating: 0, and positive for x 0, and tends asymptotically to zero as y x2 1 x 2x x2 1 2 1 x2 x2 1 2 Thus the function is decreasing for x 1, has a minimum at x 1, increases in the interval (-1,1), has a maximum at x 1, and decreases for x 1. If we lgraph this behavior, we find that there must be points of inflection sometime before x 1 and sometime after x 1. PSfrag replacements 1 0 5 1 1 0 3 2 1 0 x 2 3 0 5 8. y 1 1 x 1 x 2 Answer. The function has x 0 as a horizontal asymptote, coming from below on the left, and above on the right. The function has vertical asymptotes at x 1 and x 2. The function is positive for 0 x 1, so goes to ∞ on the left of x 1. The function is negative in the interval (1,2), so goes to ∞ on the right of x 1 and the left of x 2. Finally, the function is positive for x 2, so goes to ∞ on the right of x 2. If we graph this behavior, we get the figure below. Clearly there must be a local minimum before x 0, a local maximum somewhere in the interval 1 2 , and a point of inflection to the left of the local minimum. The precise values of these points are to be found by differentiation, but it is to be emphasized that to sketch the shape of the graph it suffices to consider the asymptotic behavior. 10 PSfrag replacements 5 0 1 0 1 2 3 4 6 5 5 5 10 9. y x2 x 1 x 2 Answer. Since the degrees of the numerator and denominator are the same and both leading coefficients are 1, the horizontal asymptote is x 1. There are vertical asymtpotes at x 1 and x 2. The function is negative in the interval 1 2 , and is otherwise positive, so has the same asymptotic behavior as the function of problem 8. To find the local minimum and maximum we differentiate: y so the local minimum is at x x2 3x 2 2x x2 2x 3 x 1 2 x 2 2 0, and the local maximum at x x 3x 4 x 1 2 x 2 2 4 3. 10 5 0 PSfrag replacements 10 5 0 5 10 5 10 10. y 1 cosx 2π x 2π Answer. First of all, we see from the behavior of the square root, that y is always positive, and has a maximum when 1 cos x has its maximum value, at x π π , and a minimum when cos x 1, at x 2π 0 π . Between these points, y is strictly increasing from minimum to maximum and strictly decreasing from maximum to minimum. Thus, the graph has to be as shown. Differentiating, we find y sin x 2 1 cosx y 1 2 1 cosx confirming that the curve is always concave down. PSfrag replacements 16 14 12 1 08 06 04 02 6 4 2 0 0 2 4 6
