0 Commodity Sheet Data
advertisement
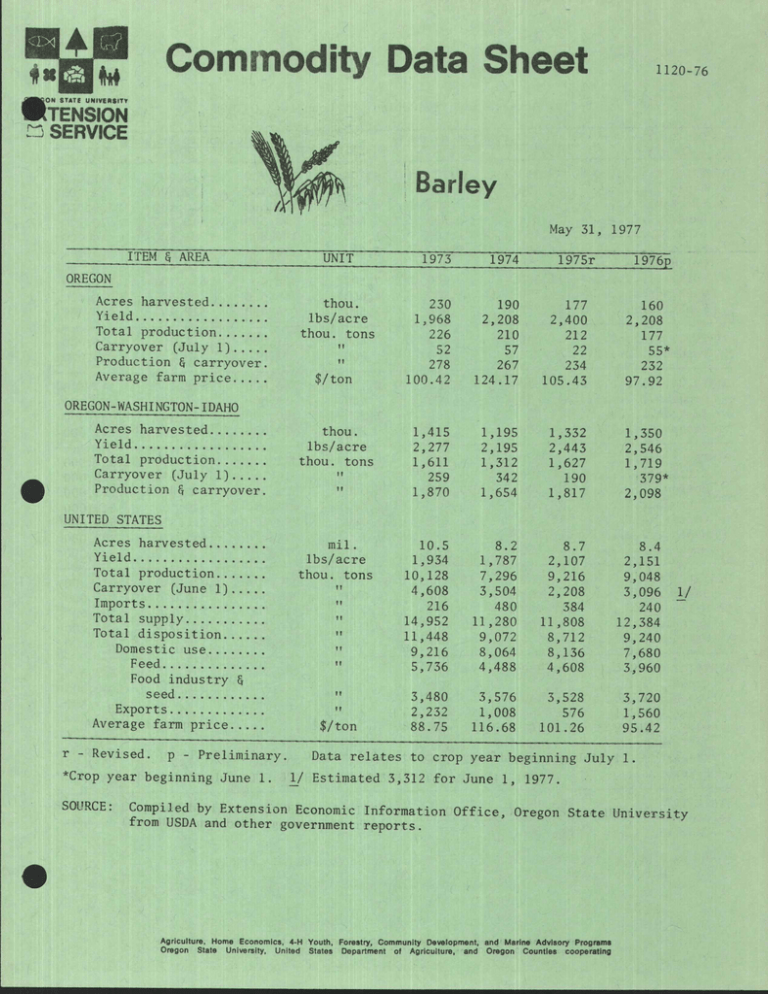
Commodity Data Sheet 0 1120 -76 ON STATE UNIVERSITY TENSION !'n SERVICE Barley May 31, 1977 ITEM $ AREA UNIT 1973 1974 230 1,968 226 190 2,208 210 52 278 57 267 100.42 124.17 1975r 1976p OREGON Acres harvested Yield Total production Carryover (July 1) Production $ carryover Average farm price H thou. lbs /acre thou. tons II It $ /ton OREGON -WASHINGTON -IDAHO 177 2,400 212 22 234 ' 160 2,208 177 55* 232 105.43 97.92 1,350 2,546 1,719 379* 2,098 1 Acres harvested Yield Total production Carryover (July 1) Production $ carryover thou. lbs /acre thou. tons I' " 1,415 2,277 1,611 1,195 2,195 1,312 259 342 1,870 1,654 1,332 2,443 1,627 190 1,817 10.5 1,934 10,128 4,608 216 14,952 11,448 9,216 5,736 8.2 1,787 7,296 3,504 480 11,280 9,072 8,064 4,488 8.7 2,107 9,216 2,208 384 11,808 8,712 8,136 4,608 8.4 2,151 9,048 3,096 240 12,384 9,240 7,680 3,960 3,480 2,232 88.75 3,576 1,008 116.68 3,528 576 101.26 3,720 1,560 95.42 UNITED STATES Acres harvested Yield Total production Carryover (June 1) Imports Total supply Total disposition Domestic use Feed Food industry seed Exports Average farm price r - Revised. p - mil. lbs /acre thou. tons It I I " " II N " " $ /ton Preliminary. Data relates to crop year beginning July 1/ 1. Estimated 3,312 for June 1, 1. 1977. Compiled by Extension Economic Information Office, Oregon State University from USDA and other government reports. II Agriculture, Home Economics, Oregon II 1/ $ *Crop year beginning June SOURCE: " State University, 4 -H Youth, Forestry, Community Development, and Marine Advisory Programs United States Department of Agriculture, and Oregon Counties cooperating n II II Barley Acreage and Production, by Counties, OREGON , DISTRICT & COUNTY . Harvested acreage 1974 DISTRICT 1 Benton Clackamas Lane Linn Marion Multnomah Polk Washington Yamhill 1 n DISTRICT 2 Columbia DISTRICT 3 Douglas Jackson Josephine ' 1975r Production in bushels 1976p 42,550 34,700 750 700 700 4,500 850 2,100 6,600 250 11,200 4,100 12,200 4,400 200 1,600 5,900 200 8,300 3,800 9,600 4,500 400 1,400 5,000 200 7,500 4,000 5,500 - 29,200 1 ' 0 , " 1,531,000 32,900 202,500 20,700 64,400 285,000 10,000 412,500 228,000 275,000 400 400 21,000 21,000 46,900 46,900 2,500 800 1,500 200 2,100 400 1,500 200 2,100 400 1,500 200 148,000 48,000 90,000 10,000 128,100 24,800 93,000 10,300 54,650 9,000 10,000 13,000 15,300 6,500 44,300 5,000 5,000 14,000 13,000 6,500 800 2,292,400 319,200 620,000 422,800 593,400 320,000 17,000 2,372,600 400,500 360,000 539,500 711,500 334,800 26,300 1,824,000 125,000 125,000 616,000 585,000 299,000 24,000 39,000 6,000 10,000 12,000 11,000 2,070,000 300,000 732,000 660,000 378,000 2,626,000 360,000 760,000 930,000 576,000 2,075,700 270,000 709,000 480,000 616,000 850 850 DISTRICT 5 Baker Malheur Union Wallowa 36,200 6,000 12,200 12,000 6,000 40,000 6,000 10,000 15,000 9,000 42,350 1,500 44,850 1,500 45,000 1,200 500 300 6,100 500 350 7,500 1,300 350 350 7,000 e \ 1,878,900 32,900 213,100 10,200 81,600 365,800 10,400 456,500 190,000 518,400 1976p 1 700 700 66,050 8,400 15,500 18,000 15,300 8,000 1 ' 2,253,700 33,750 202,500 42,500 106,800 396,000 11,250 560,00 266,500 634,400 1975r 350 350 DISTRICT 4 Gilliam Morrow Sherman Umatilla Wasco Wheeler I 1974 ' ' I' . 26,000 26,000 ' 117,500 24,000 82,500 11,000 1 DISTRICT 6 Crook Deschutes Grant Harney Jefferson Klamath Lake u II II 1,300 26,250 6,400 29,300 4,400 190,000 177,000 1 I 1,200 30,100 4,800 1,954,900 112,500 25,000 8,400 152,500 58,500 1,470,000 128,000 1,797,500 102,000 25,700 10,500 258,700 71,500 1,127,100 202,000 160,000 8,740,000 8,850,000 E STATE TOTAL r - Revised. SOURCE: p - I ,, 1,785,800 60,000 15,800 10,500 210,000 60,000 1,327,500 102,000 7,360,000 Preliminary. Compiled by Extension Economic Information Office, Oregon State University. March 9, 1977 (1120) -76 BARLEY, VALUE OF SALES á/ From Crops Harvested, by Counties in OREGON, 1972 -1976 . DISTRICT $ COUNTY 1972 1973 1974 1975r 1976p thousand dollars DISTRICT 1 Benton Clackamas 2,853 5,406 124 6,084 4,102 2,899 74 80 70 185 79 176 412 397 92 276 823 509 106 280 1,059 437 59 358 37 115 541 22 36 26 19 22 758 502 645 1,410 1,581 649 1,794 1,039 400 1,179 827 418 522 27 27 38 38 52 52 111 111 57 57 123 336 124 196 369 128 218 262 37 203 212 29 163 11 16 23 22 20 6,218 485 987 1,179 2,846 702 4,910 449 1,089 1,416 1,288 636 6,249 1,810 1,167 1,572 893 5,342 836 918 1,158 1,653 747 3,525 281 240 1,178 1,185 619 19 32 17 30 22 DISTRICT S Baker Malheur Union Wallowa 2,346 167 893 786 500 4,591 488 2,059 1,459 585 4,721 565 1,723 1,347 1,086 5,353 590 1,586 1,683 1,494 4,047 371 1,198 776 1,702 DISTRICT 6 Crook Deschutes Grant Harney Jefferson Klamath 2,287 100 4,038 260 5,185 284 3,863 225 3,788 24 50 59 54 112 30 8 332 138 10 513 151 355 107 Lane Linn Marion Multnomah Polk Washington Yamhill DISTRICT 2 Columbia DISTRICT 3 Douglas Jackson Josephine 189 55 DISTRICT 4 Gilliam Morrow Sherman Umatilla Wasco Wheeler 6 88 181 r - Revised. p - ` - 790 -98 756 8 1,799 390 3,099 4,086 2,566 3,015 89 141 278 344 161 13,920 19,319 22,660 19,033 14,528 Lake STATE TOTAL 671 1,577 21 181 ' Preliminary. a/ Crop year includes quantity sold or held for sale. SOURCE: Compiled by Extension Economic Information Office, Oregon State University. June 20, 1977 BARLEY: Acreage, Yield, Harvested acreage Year 1,000 acres 1930 Production, Price, and Value, Yield per acre OREGON, 1930-1976 Value of production Price per ton Production 1,000 tons tons 72 dollars 1,000 dollars .75 53.9 20.00 1,078 . 1940 213 .60 127.8 20.80 2,662 1945 1946 1947 1948 1949 1I 1950 1951 1952 1953 1954 257 278 300 351 274 .71 .82 .85 .83 .77 182.0 226.8 255.6 290.6 210.4 44.20 55.00 70.00 49.60 48.30 8,037 12,477 17,892 14,411 10,171 I, . I 337 337 276 301 527 .77 .74 258.8 250.7 251.7 274.5 468.0 , .91 .91 .89 ' 52.10 57.90 65.00 49.60 48.80 13,480 14,521 16,361 13,611 22,814 41.20 43.30 40.80 42.10 42.10 17,709 22,230 21,431 20,089 19,833 1 1955 559 570 616 585 538 .77 .90 .85 .82 .88 429.3 513.0 524.8 477.4 471.3 1960 1961 1962 1963 1964 457 484 .86 .83 407 427 393 1.04 394.8 400.8 424.9 399.7 382.0 42.90 44.20 42.10 40.80 43.75 1965 1966 1967 1968 1969 369 1.10 410 266 279 399 .98 .78 .90 407.4 403.4 207.5 251.1 421.3 45.00 48.35 46.25 42.09 39.17 18,332 19,500 9,596 10,567 16,503 1.10 436.1 434.5 288.0 226.3 210.0 42.91 45.00 60.42 100.42 124.17 18,715 19,553 17,400 22,726 26,045 1.20 1.10 212.4 176.6 105.43 97.92 22,391 17,296 1956 1957 1958 1959 .94 .97 1.06 " , ' 16,946 17,700 17,881 16,320 16,712 I. 1970 1971 1972 1973 1974 395 355 1975r 1976p 177 160 r - 250 230 190 Revised. SOURCE: p - 1.10 1.22 1.15 .94 . Preliminary. Compiled by Economic Information Office, Oregon State University Extension Service, from USDA reports.
