Indicator 6. Number of Forest-Dependent Species
advertisement
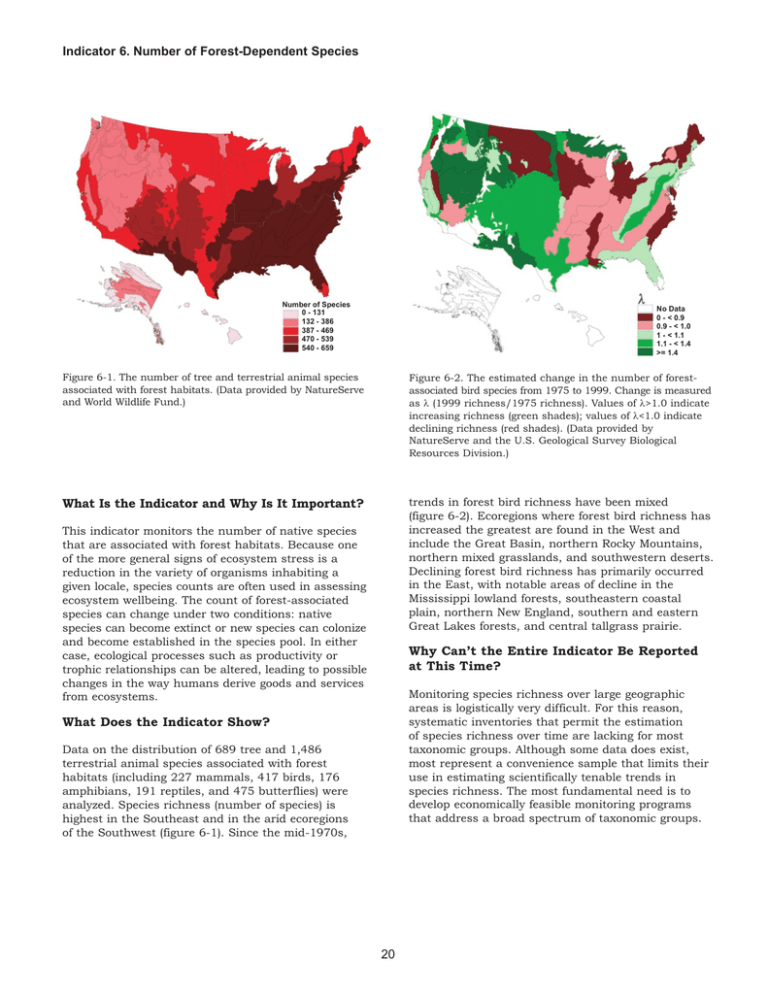
Indicator 6. Number of Forest-Dependent Species Number of Species 0 - 131 132 - 386 387 - 469 470 - 539 540 - 659 No Data 0 - < 0.9 0.9 - < 1.0 1 - < 1.1 1.1 - < 1.4 >= 1.4 Figure 6-1. The number of tree and terrestrial animal species associated with forest habitats. (Data provided by NatureServe and World Wildlife Fund.) Figure 6-2. The estimated change in the number of forestassociated bird species from 1975 to 1999. Change is measured as λ (1999 richness/1975 richness). Values of λ>1.0 indicate increasing richness (green shades); values of λ<1.0 indicate declining richness (red shades). (Data provided by NatureServe and the U.S. Geological Survey Biological Resources Division.) What Is the Indicator and Why Is It Important? trends in forest bird richness have been mixed (figure 6-2). Ecoregions where forest bird richness has increased the greatest are found in the West and include the Great Basin, northern Rocky Mountains, northern mixed grasslands, and southwestern deserts. Declining forest bird richness has primarily occurred in the East, with notable areas of decline in the Mississippi lowland forests, southeastern coastal plain, northern New England, southern and eastern Great Lakes forests, and central tallgrass prairie. This indicator monitors the number of native species that are associated with forest habitats. Because one of the more general signs of ecosystem stress is a reduction in the variety of organisms inhabiting a given locale, species counts are often used in assessing ecosystem wellbeing. The count of forest-associated species can change under two conditions: native species can become extinct or new species can colonize and become established in the species pool. In either case, ecological processes such as productivity or trophic relationships can be altered, leading to possible changes in the way humans derive goods and services from ecosystems. Why Can’t the Entire Indicator Be Reported at This Time? Monitoring species richness over large geographic areas is logistically very difficult. For this reason, systematic inventories that permit the estimation of species richness over time are lacking for most taxonomic groups. Although some data does exist, most represent a convenience sample that limits their use in estimating scientifically tenable trends in species richness. The most fundamental need is to develop economically feasible monitoring programs that address a broad spectrum of taxonomic groups. What Does the Indicator Show? Data on the distribution of 689 tree and 1,486 terrestrial animal species associated with forest habitats (including 227 mammals, 417 birds, 176 amphibians, 191 reptiles, and 475 butterflies) were analyzed. Species richness (number of species) is highest in the Southeast and in the arid ecoregions of the Southwest (figure 6-1). Since the mid-1970s, 20
