Math 1070-1, (Practice) Midterm 2 Spring 2003
advertisement
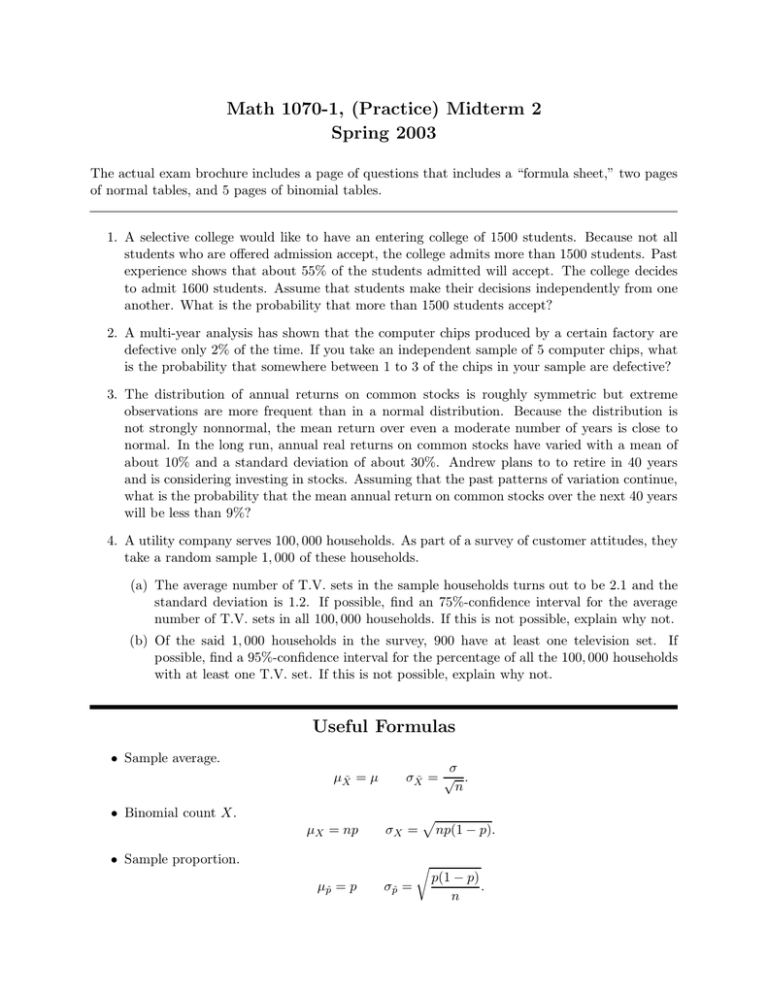
Math 1070-1, (Practice) Midterm 2 Spring 2003 The actual exam brochure includes a page of questions that includes a “formula sheet,” two pages of normal tables, and 5 pages of binomial tables. 1. A selective college would like to have an entering college of 1500 students. Because not all students who are offered admission accept, the college admits more than 1500 students. Past experience shows that about 55% of the students admitted will accept. The college decides to admit 1600 students. Assume that students make their decisions independently from one another. What is the probability that more than 1500 students accept? 2. A multi-year analysis has shown that the computer chips produced by a certain factory are defective only 2% of the time. If you take an independent sample of 5 computer chips, what is the probability that somewhere between 1 to 3 of the chips in your sample are defective? 3. The distribution of annual returns on common stocks is roughly symmetric but extreme observations are more frequent than in a normal distribution. Because the distribution is not strongly nonnormal, the mean return over even a moderate number of years is close to normal. In the long run, annual real returns on common stocks have varied with a mean of about 10% and a standard deviation of about 30%. Andrew plans to to retire in 40 years and is considering investing in stocks. Assuming that the past patterns of variation continue, what is the probability that the mean annual return on common stocks over the next 40 years will be less than 9%? 4. A utility company serves 100, 000 households. As part of a survey of customer attitudes, they take a random sample 1, 000 of these households. (a) The average number of T.V. sets in the sample households turns out to be 2.1 and the standard deviation is 1.2. If possible, find an 75%-confidence interval for the average number of T.V. sets in all 100, 000 households. If this is not possible, explain why not. (b) Of the said 1, 000 households in the survey, 900 have at least one television set. If possible, find a 95%-confidence interval for the percentage of all the 100, 000 households with at least one T.V. set. If this is not possible, explain why not. Useful Formulas • Sample average. µX̄ = µ • Binomial count X. µX = np σ σX̄ = √ . n σX = • Sample proportion. p r µp̂ = p σp̂ = np(1 − p). p(1 − p) . n


