2014 Taft College Student Success Scorecard
advertisement

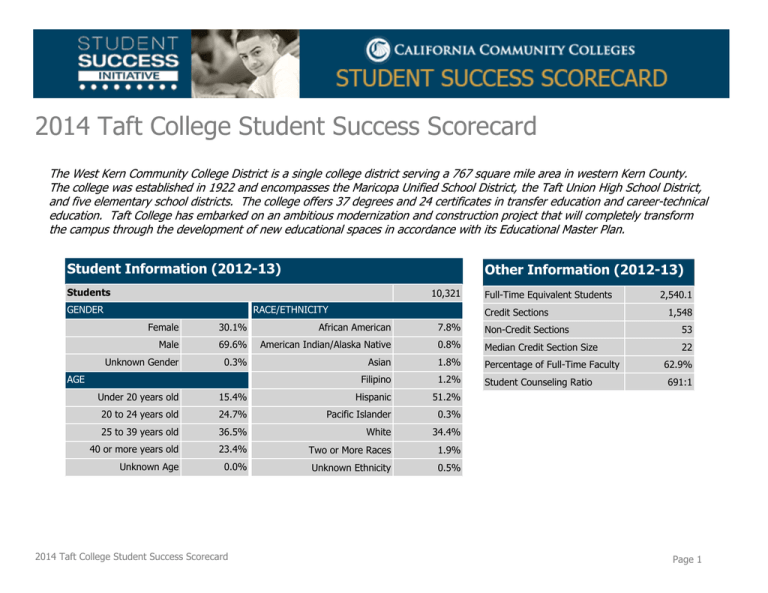
2014 Taft College Student Success Scorecard The West Kern Community College District is a single college district serving a 767 square mile area in western Kern County. The college was established in 1922 and encompasses the Maricopa Unified School District, the Taft Union High School District, and five elementary school districts. The college offers 37 degrees and 24 certificates in transfer education and career-technical education. Taft College has embarked on an ambitious modernization and construction project that will completely transform the campus through the development of new educational spaces in accordance with its Educational Master Plan. Student Information (2012-13) Other Information (2012-13) Students 10,321 GENDER RACE/ETHNICITY Full-Time Equivalent Students Credit Sections 2,540.1 1,548 Female 30.1% African American 7.8% Non-Credit Sections 53 Male 69.6% American Indian/Alaska Native 0.8% Median Credit Section Size 22 Unknown Gender 0.3% Asian 1.8% Percentage of Full-Time Faculty Filipino 1.2% Student Counseling Ratio AGE Under 20 years old 15.4% Hispanic 51.2% 20 to 24 years old 24.7% Pacific Islander 0.3% 25 to 39 years old 36.5% White 34.4% 40 or more years old 23.4% Two or More Races 1.9% Unknown Age 0.0% Unknown Ethnicity 0.5% 2014 Taft College Student Success Scorecard 62.9% 691:1 Page 1 2014 Taft College Student Success Scorecard Metrics Completion Persistence 30 Units Remedial Unprepared Overall Prepared Unprepared Overall Prepared Unprepared Overall Math English ESL Career Technical Education Prepared 73.0% 28.2% 34.4% 76.2% 59.3% 61.6% 65.1% 52.9% 54.6% 24.2% 42.7% 36.4% 47.1% Female 79.4% 30.8% 37.9% 79.4% 65.7% 67.7% 64.7% 53.0% 54.7% 25.6% 48.4% 38.5% 60.7% Male 65.5% 25.6% 30.8% 72.4% 52.8% 55.4% 65.5% 52.8% 54.5% 21.8% 33.7% 33.3% 40.3% Under 20 years old 74.5% 28.3% 35.8% 81.8% 62.9% 66.0% 67.3% 50.5% 53.3% 29.2% 37.7% 50.0% 46.3% 20 to 24 years old 75.0% 17.4% 22.0% 75.0% 39.1% 42.0% 50.0% 56.5% 56.0% 25.0% 45.1% 0.0% 54.4% 25 to 39 years old 50.0% 32.7% 34.0% 0.0% 57.1% 52.8% 50.0% 61.2% 60.4% 19.0% 49.0% 40.0% 48.3% 40 or more years old NA 46.7% 46.7% NA 60.0% 60.0% NA 60.0% 60.0% 11.3% 47.6% 33.3% 29.4% African-American 100.0% 43.5% 45.8% 0.0% 69.6% 66.7% 100.0% 65.2% 66.7% 36.4% 53.1% NA 35.7% American Indian/Alaska Native 100.0% 0.0% 33.3% 100.0% 50.0% 66.7% 100.0% 0.0% 33.3% 0.0% 0.0% NA NA Asian 80.0% 75.0% 77.8% 100.0% 50.0% 77.8% 100.0% 50.0% 77.8% 57.1% 66.7% NA 69.2% Filipino 0.0% 42.9% 37.5% 0.0% 85.7% 75.0% 100.0% 71.4% 75.0% 44.4% 50.0% 0.0% 62.5% Hispanic 66.7% 24.8% 29.2% 61.1% 58.8% 59.1% 55.6% 57.5% 57.3% 25.0% 42.4% 38.1% 44.3% Pacific Islander NA 33.3% 33.3% NA 100.0% 100.0% NA 66.7% 66.7% 25.0% 33.3% NA NA White 72.7% 29.8% 36.5% 81.8% 57.9% 61.6% 60.6% 50.6% 52.1% 22.8% 40.2% NA 52.2% Cohort Tracked for Six Years Through 2012-13 Cohort 2014 Taft College Student Success Scorecard Page 2


