LESSONS FROM 5 YEARS OF VEGETATION MONITORING ON THE NEVADA TEST SITE
advertisement
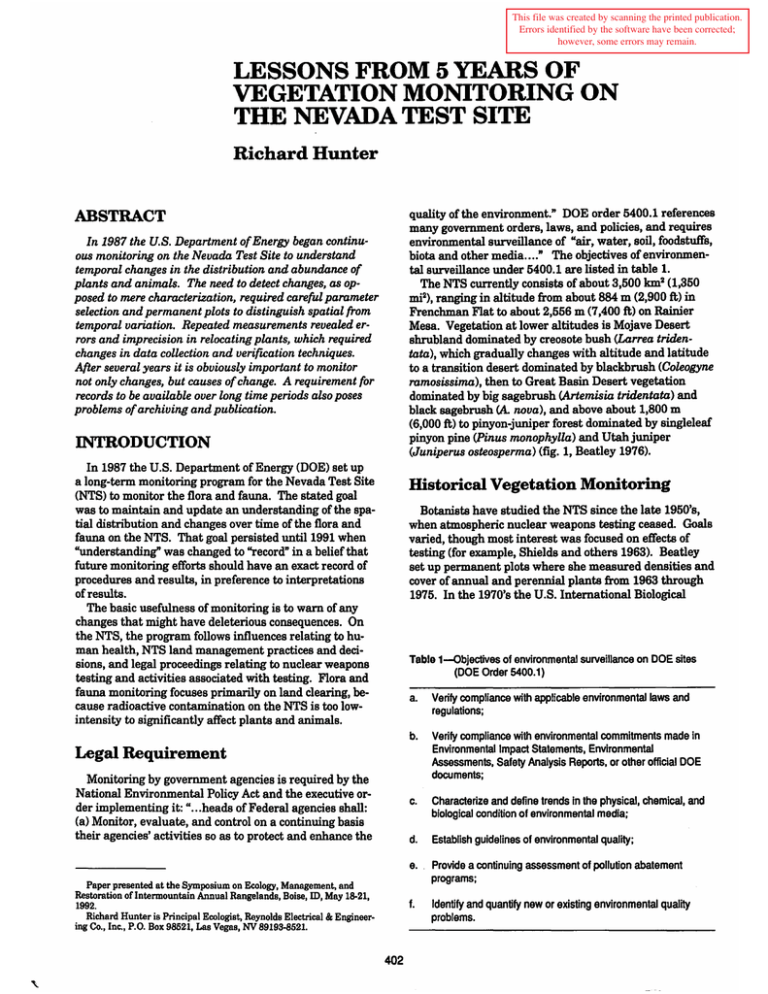
This file was created by scanning the printed publication. Errors identified by the software have been corrected; however, some errors may remain. LESSONS FROM 5 YEARS OF VEGETATION MONITORING ON THE NEVADA TEST SITE Richard Hunter quality of the environment." DOE order 5400.1 references many government orders, laws, and policies, and requires environmental surveillance of "air, water, soil, foodstuffs, biota and other media ...." The objectives of environmental surveillance under 5400.1 are listed in table 1. The NTS currently consists of about 3,500 km2 (1,350 mi2), ranging in altitude from about 884 m (2,900 ft) in Frenchman Flat to about 2,556 m (7 ,400 ft) on Rainier Mesa. Vegetation at lower altitudes is Mojave Desert shrubland dominated by creosote bush (Larrea tridentata), which gradually changes with altitude and latitude to a transition desert dominated by blackbrush (Coleogyne ramosissima), then to Great Basin Desert vegetation dominated by big sagebrush (Artemisia tridentata) and black sagebrush (A nova), and above about 1,800 m (6,000 ft) to pinyon-juniper forest dominated by singleleaf pinyon pine (Pinus monophylla) and Utah juniper (Juniperus osteosperma) (fig. 1, Beatley 1976). ABSTRACT In 1987 the U.S. Department of Energy began continuous monitoring on the Nevada Test Site to understand temporal changes in the distribution and abundance of plants and animals. The need to detect changes, as opposed to mere characterization, required careful parameter selection and permanent plots to distinguish spatial from temporal variation. Repeated measurements revealed errors and imprecision in relocating plants, which required changes in data collection and verifreation techniques. After several years it is obviously important to monitor not only changes, but causes of change. A requirement for records to be available over long time periods also poses problems of archiving and publication. INTRODUCTION In 1987 the U.S. Department of Energy (DOE) set up a long-term monitoring program for the Nevada Test Site (NTS) to monitor the flora and fauna. The stated goal was to maintain and update an understanding of the spatial distribution and changes over time of the flora and fauna on the NTS. That goal persisted until1991 when "understanding" was changed to "record" in a belief that future monitoring efforts should have an exact record of procedures and results, in preference to interpretations of results. The basic usefulness of monitoring is to warn of any changes that might have deleterious consequences. On the NTS, the program follows influences relating to human health, NTS land management practices and decisions, and legal proceedings relating to nuclear weapons testing and activities associated with testing. Flora and fauna monitoring focuses primarily on land clearing, because radioactive contamination on the NTS is too lowintensity to significantly affect plants and animals. Historical Vegetation Monitoring Botanists have studied the NTS since the late 1950's, when atmospheric nuclear weapons testing ceased. Goals varied, though most interest was focused on effects of testing (for example, Shields and others 1963). Beatley set up permanent plots where she measured densities and cover of annual and perennial plants from 1963 through 1975. In the 1970's the U.S. International Biological Table 1-0bjectives of environmental surveillance on DOE sites (DOE Order 5400.1) a. Verify compliance with applicable environmental laws and regulations; b. Verify compliance with environmental commitments made in Environmental Impact Statements, Environmental Assessments. Safety Analysis Reports, or other official DOE documents; c. Characterize and define trends In the physical. chemical, and biological condition of environmental media; d. Establish guidelines of environmental quality; Legal Requirement Monitoring by government agencies is required by the National Environmental Policy Act and the executive order implementing it: "... heads of Federal agencies shall: (a) Monitor, evaluate, and control on a continuing basis their agencies' activities so as to protect and enhance the e. . Provide a continuing assessment of pollution abatement programs; Paper presented at the Symposium on Ecology, Management, and Restoration oflntermountain Annual Rangelands, Boise, ID, May 18-21, 1992. Richard Hunter is Principal Ecologist, Reynolds Electrical & Engineering Co., Inc., P.O. Box 98521, Las Vegas, NV 89193-8521. f. 402 Identify and quantify new or existing environmental quality problems. PAHUTEMESA SHOSHONE MOUNTAIN VEGETATION TYPES ON THE NEVADA TEST SITE ~~LARREA ffiili} COLEOGYNE D COLEOGYNE EJ ~ LYCIUM PAW DUM [W ATRIPLEX LARREA/ ~ARTEMISIA GRAYIA-LYCIUM D MOUNTAINS, HIU.S, ANO MESAS Figure 1- Vegetation types on the Nevada Test Site. 403 m LYCIUM SHOCKLEY! SCALE 0)~~1"' ~iHHi km tN Program's Desert Biome collected data on Mojave Desert annual and perennial plants in Rock Valley. Many scientific papers have been published on the NTS biota by biologists working on these and several smaller projects (O'Farrell and Emery 1976). The work that most closely approached a monitoring effort was the work by Janice Beatley on 68 plots. Her raw data are stored at the Desert Laboratory, University of Arizona, and can be used to determine annual plant population parameters for periods of more than 10 years at seven plots, and for 5 years at others. She published 1963-75 summary data for perennial population changes on plots grouped by vegetation "type" (Beatley 1979). My goal for this paper was to provide information on potential problems in setting up programS for monitoring plant and animal populations. It is based on experience over the first 5 years (1987-92) of the NTS monitoring program. human exposure), locations of drill holes for test emplacement, outlines of subsidence craters (resulting from underground weapons tests), and roads. The extent of range fires from 1978 to 1988 was estimated by the NTS fire department. Widths of paved and dirt roads were measured, and lengths estimated from maps. The extent of blast zones denuded by shock waves from aboveground tests was estimated from a published map (Allred and others 1963a). The extent of waste burial areas was reported by NTS' Low-Level-Waste-Management personnel. Hunter and others (1992) reported surface areas for these various disturbances (table 2). The primary reasons for monitoring permanent plots were that they could be located at points of previous studies, they remove spatial variability, they allow efficiencies in work effort, and densities could be determined on plots, whereas techniques based on lines or points only provide relative values. Five permanent baseline plots (300 by 300 m) were set up in 1987 and 1988, and smaller plots were set up in particular disturbances to monitor recovery or changes associated with the disturbance. If possible, plots were set up at sites studied by earlier researchers, to provide historical continuity and to extend the time span monitored. Plots were marked with metal stakes covered by PVC pipe, with brass markers attached to the PVC. Their locations were surveyed by global positioning system equipment (GPS). An attempt was made to monitor parameters that were not technique dependent. Largely nondestructive measurements were attempted for species composition and mean density, size, sex, or weight, but not for cover, frequency, diversity, or relative abundance. Confidence limits were calculated for each measurement. Estimates for cover and biomass of plants and such parameters as survivorship of animals were derived from primary data. We harvested 0.025-m2 randomly placed quadrats for annual plants, made dimensional measurements of perennial plants in permanent belt transects, and made mark-recapture density estimates for lizards and small mammals on permanent plots. Cover and biomass were estimated assuming an ovate cylindrical shape for all shrubs and an experimentally determined regression of weight verses volume (Hunter and Medica 1989). Certain species are too rare to sample on small plots, and too important to be ignored. Examples include desert tortoises (a threatened species since 1990), deer, and horses, as well as certain larger plants, in particular Joshua tree (Yucca brevifolia), Mojave yucca (Yucca schidigera), Utahjuniper, and singleleafpinyon pine. To monitor the status of those species we marked individuals and monitored growth, death, and health status at intervals of one to several years. We did not attempt to measure their densities, but did monitor their health status and threats to their health. Convenient, rather than random, populations were selected (generally on or adjacent to permanent baseline plots), and no specific attempt was made to study those species in relation to particular disturbances. Common names for plant species follow Scott and Wasser (1980) and DeDecker (1984). METHODS The Basic Environmental Compliance and Monitoring Program (BECAMP), set up by DOE in 1987, uses historical data and current measurements of plants and animals at specific sites to assess effects of DOE operations. Historical data include published reports (see O'Farrell and Emery 1976) and a considerable amount of raw data present when BECAMP monitoring began. Raw data were collected, microfilmed, and stored, and reprints were collected from libraries. Attempts were made to compare results from the first years of BECAMP data with historical measurements to detect significant changes in small mammal and plant populations. Examination oflocal high-resolution maps enabled us to choose study sites where changes due to DOE activities were likely. These maps included fences surrounding radiation exclusion zones (areas of potential significant Table 2-Extent of various disturbances on the Nevada Test Site, estimated from high-resolution maps Disturbance Burned, 1978-87 Blast zones, 1950's Radiation exclusion Drill pads Paved roads Subsidence craters Pu contamination Dirt roads Facilities Waste burial Waste radex Tunnel radex Total Percent of total area Percent of disturbed area 4.33 1.59 .57 .36 .27 .25 <.18 >.11 .09 .08 .03 .02 55.0 20.2 7.2 4.6 3.4 3.2 <2.3 >1.4 1.1 1.0 .4 .2 7.88 100.0 404 RESULTS line), and Beatley did not measure widths of sampled plants, so cover could not be derived from her size data as it is with belt transect data. Only carefully worded and vague comparisons, and no firm conclusions as to change in vegetation cover, density, or biomass could be drawn from use of the two techniques. Determining the extent of disturbance by human activities and natural forces from maps proved very useful in siting study plots. Fires were a very significant disturbance (table 2), and were therefore given some priority in sampling effort. Plots were set up to sample each of the top six disturbances (table 2). Since the program started we ceased sampling the one radioactive plot, primarily because spatial variation in vegetative parameters surrounding the site prevented selection of a suitable comparison plot. We were, however, also unable to postulate any measurable effects of the contamination on that site, considering dose rates effects determined in previous NTS studies (French and others 1974; Kaaz and others 1971; Vollmer and Bamberg 1975). Sampling is still being carried out on burned areas, blast zones, drill pads, subsidence craters, and paved roads. The value of separating spatial from temporal variability can be demonstrated with an analysis of variability of population densities on five transects within two 9-ha plots sampled in 1987. Not one of 10 common species' mean densities could be determined to within 25 percent by five transects (table 4). Numbers of randomly placed transects needed to detect density differences of 25 percent varied from nine to 964. Transects take two to four person-days each to measure, and considerably longer to analyze, and it was therefore impractical to try to reach even that level of precision by sampling random nearby points. This means there was no effective way to measure multiple random transects to monitor changes in plant density. Differences in technique of the various NTS researchers were a significant hindrance to use of historical data. Only Beatley's annual data for Rock Valley have been used (Hunter 1990, 1991), and that was possible only for density. Sampling by Brigham Young University (BYU) at the Sedan event site provided data that. could be used to calculate small mammal densities, although the authors refrained from doing so (Allred and others 1963b). Other researchers measured parameters like radionuclide content, trap success, or species composition. There were no density estimates of lizards in the historical record. A comparison of Beatley's line intercept technique and BECAMP's belt transect shows how technique dependence can influence comparisons, and illustrates why technique continuity is so important for monitoring. To make this comparison, in 1989 we used both techniques to examine plant populations within Beatley's plot 3. A total of 335 m (1,100 ft) of line intercept (Beatley 1979) are compared to 100m2 of belt transect (following Hunter and Medica 1989). Summary statistics reveal sizable differences for mean height, percentage of the population, and percent cover (table 3). Mean heights (by species) were estimated to be larger by line intercept than by belt transect (paired t =4.52, 10 d.f., p =0.001). This occurs because plants are intersected by a line only when their bases are within one canopy radius of the line. Therefore, larger plants have a greater probability of being selected. Belt transects select all plants with bases within the area sampled, and are not biased toward large plants. Cover by belt transect was inflated because of the inability to correct for overlap in plant canopies. The "mean cover" for the line intercept technique is easily calculated by ignoring species, while "total cover" (table 3) includes overlap. One cannot calculate density for line intercept data (Beatley reporte4 plants per 335 m of Table 3-Comparison of Beatley's line intercept and BECAMP's belt transect techniques. Line intercept overestimated percent of population (%n) and height (ht, em) for large plants, and belt transects overestimated cover (%c) Line lnterceRI Species desert needlegrass Indian ricegrass desert globemallow Shockley goldenhead bursage littleleaf krameria Mojave aster winterfat spiny hopsage Nevada ephedra Anderson wolfberry Fremont dalea common blackbrush pale wolfberry creosote bush Total population Total cover Cover, no overlap o.kn %c 0 0 0.4 1.3 39.3 1.7 1.7 .9 7.4 13.5 7.0 .9 2.6 6.1 10.0 0 0 0.0 .1 11.4 1.7 .2 .1 2.0 4.6 3.0 0.5 .6 2.4 6.8 229 36.2% 29.9% 405 ht 6 32 39 44 49 50 56 58 60 61 66 70 109 o.kn 0.6 .6 .6 0 48.3 1.2 5.2 3.5 5.8 15.7 7.6 0 1.7 2.6 5.8 Belt transect %c 0.0 .0 .0 0 10.9 1.3 .3 .3 1.5 6.4 4.5 0 3.2 1.5 12.8 172 42.7% ht 1 3 4 0 30 32 27 40 51 43 55 64 48 81 Table 4-Average plant numbers per transect from five-replicate, randomly placed 1OO-m2 belt transects, and estimated numbers of transects needed to detect a change in a species' density of 25 percent at p =0.05 (Bonham 1989) Species Shockley goldenhead bursage winterfat Nevada ephedra spiny hopsage white burrobrush creosotebush Anderson wolfberry Indian ricegrass Frenchman Flat Number Transects 20.4 35.2 7.8 .2 2.8 41.6 8.0 1.8 5.1 19 36 335 964 79 29 17 250 45 found they differed significantly by chi-square analysis 253, d.f. = 28, p << 0.001). For practical purposes, therefore, measuring the status of an "association" was not considered a goal when setting up the BECAMP monitoring program. Our intent was to measure the status of individual species. We do, however, measure community components (densities, sizes by species), which we presume will allow significant changes to be detected. (;t2 = Yucca Flat Number Transects 54.1 9 63.8 24.8 34.8 23.6 20 102 22 123 7.8 14.1 185 77 DISCUSSION Hard lessons are embodied in some of the foregoing experiences. The inability to make significant use of the relatively extensive history of biological research on the NTS was not expected, nor were the problems with precision in the perennial plant measurements. Spatial variability in plant species distributions was only guessed at prior to the first analysis of replicate transects. The tentative solution of use of permanent plots or transects is unsatisfying because by aiming at good temporal trends we have eliminated the possibility of measuring spatial distribution, except on a superficial level. There are some obvious but nevertheless important conclusions to be drawn for others who might be in the initial stages oflong-term monitoring programs. It is important to carefully pick parameters to be measured. Some good recommendations have already been made, such as monitoring all trophic levels in an ecosystem (Bruns and others 1991; Wiersma 1990), but such recommendations are divorced from fiscal concerns. I believe it is important to measure absolute rather than relative parameters, because techniques continually change, hopefully improving. We are currently considering changes in trap design, and wider use of GPS for locations. Hopefully, changing traps will not change mark-recapture density estimates, and GPS locations will be accurate enough to compensate for future loss of some plot boundary markers. "Disturbances" (table 2) that were used to set priorities for plot selection do not include general ones such as air pollution, climate change, grazing, and introduced Temporal variability in plant numbers on a single transect was much lower than the spatial variability in density. For example, on one belt transect in 1990, 412 shrubs were found. In 1991, 395 (91 percent), or their remains, were identified. Only 17 (4 percent) could not be found. In addition, 35 more (8 percent) were found in 1991. Intrayear changes were largely due to difficulties distinguishing separate plants in clumps of similar individuals (ambiguous numbers), to inexact locations (tape placement), and ambiguous locations (inexact measurement). Of the 35 "new" plants, only three were considered seedlings in 1991 (table 5). Thus, we can define a species' density on one permanent transect to within a few percent, but with five transects density on randomly sampled areas could be defined to within a factor of 2 only for the most common species (Bonham 1989: 67 -69). The better precision with permanent transects therefore allows us to follow temporal trends that could only be guessed at with random sampling. Lacking random samples, however, inferences about the broader community cannot be made from permanent transect data, although differences between measured points can be tested with several statistical techniques. When ambiguous locations were found to be a problem, several changes were made. In 1988 and 1989 plant locations were recorded to ±25 em from a steel tape, and within 1m along the tape. After 1989, distances from the tape were recorded to ±1 em, and distances along the tape to the nearest decimeter. The center of the 50-m tape (25 m) was pinned by permanent lath stakes to prevent wind displacement. Plants just outside the edge of the belt were marked, and students measuring the plants were given data sheets generated from the previous year's data, forcing them to try to find each plant. Finally, data from each transect were checked in the field by senior personnel before the data were analyzed. The increased precision is evident in table 5 for the 1990-91 period. Beatley divided NTS vegetation into "plant associations" defined by the dominant species (for example pinyon-juniper, Larrea-Ambrosia, Grayia-Lycium, flg. 1). I examined the distribution of species abundances within five transects located within 300 m of Beatley plot 46 and Table 5-Reasons for inability to match plants from one transect with the same plants in the previous year's data Symptoms Plants matched (live and dead) Matched but ambiguously alive Plants that disappeared Tape placement-edge plants not measured Ambiguous number of individuals Ambiguous locations Plants missed year 1, present year 2 Plants missed year 2, present year 1 Mismeasured or misrecorded Misidentified species, year 1 New small plants, probable seedlings Totals Percent successfully matched 406 1989·90 1990·91 177 39 8 396 13 5 26 66 18 55 15 10 19 15 20 0 446 441 48 93 0 2 0 0 3 3 species. Although baseline plots are being affected by these influences, the absence of "controls" is another source of discomfort. How can we isolate the effects of, for example, a 2-degree temperature rise, from concurrent fluctuations in precipitation or increased competition for water due to new species introductions? Over the first 5 years of monitoring there were changes in all of the populations measured. Drought appeared to cause most changes, but grass and shrub populations on denuded areas were slowly recovering, north- and southfacing slopes of subsidence craters were changing, the species mix of annual plants was changing, and small mammals located near roadsides appeared to be reproducing better than controls. Monitoring was thus detecting change, but one is then led to ask, what was causing these changes? More important, are we collecting evidence that can allow us to choose between, for example, predatorprey interactions and disturbance effects on lizard populations? Answers to those questions posed by the results of monitoring will probably have to be based on shorter term research projects. Thus, a monitoring program should plan to include some mechanism for funding and performing research on ecosystem processes and responses to disturbance. Finally, the preservation of data and results is an unsolved problem. We produce an annual summary report, which is published as a government document (for example, Hunter and Medica 1989). Data from the NTS will also be archived. Nevertheless, knowledge of the data's existence is liable to depend on publication of selected results in refereed journals. transition of the Nevada Test Site, 1963-1975. U.S. Department of Energy, DOE/NV/2307-15. 52 p. Available from National Technical Information Service, U.S. Department of Commerce, 5285 Port Royal Road, Springfield, VA 22161. Bonham, Charles D. 1989. Measurements for terrestrial vegetation. New York: John Wiley & Sons. 338 p. Bruns, D. A.; Wiersma, G. B.; Rykiel, Edward J., Jr. 1991. Ecosystem monitoring at global baseline sites. Environmental Monitoring and Assessment. 17(1): 3-31. DeDecker, Mary. 1984. Flora of the northern Mojave Desert, California. Spec. Publ. 7. Berkeley, CA: California Native Plant Society. 164 p. French, N. R.; Maza, B. G.; Hill, H. 0.; Aschwanden, A. P.; Kaaz, H. W. 1974. A population study of irradiated desert rodents. Ecological Monographs. 44(1): 45-72. Hunter, R. B. 1990. Recent increases in Bromus populations on the Nevada Test Site. In: McArthur, E. D.; Romney, E. M.; Smith, S. D.; Tueller, P. T., comps. Proceedings-symposium on cheatgrass invasion, shrub die-off, and other aspects of shrub biology and management. Gen. Tech. Rep. INT-276. Ogden, UT: U.S. Department of Agriculture, Forest Service, Intermountain Research Station: 22-25. Hunter, R. B. 1991. Bromus invasions on the Nevada Test Site: present status of B. rubens and B. tectorum with notes on their relationship to disturbance and altitude. Great Basin Naturalist. 51(2): 176-182. Hunter, R. B.; Medica, P. A. 1989. Status of the flora and fauna on the Nevada Test Site: results of continuing basic environmental research January through December 1987. U.S. Department of Energy, DOE/NV/10630-2. 103 p. Available from National Technical Information Service, U.S. Department of Commerce, 5285 Port Royal Road, Springfield, VA 22161. Kaaz, H. W.; Wallace, A.; Romney, E. M. 1971. Effect of a chronic exposure to gamma radiation on the shrub Ephedra nevadensis in the northern Mojave Desert. Radiation Botany. 11:33-37. O'Farrell, Thomas P.; Emery, LaVerne A. 1976. Ecology of the Nevada Test Site: a narrative summary and annotated bibliography. NV0-167. U.S. Energy Research and Development Administration, Nevada Operations Office. 249 p. Available from National Technical Information Service, U.S. Department of Commerce, 5285 Port Royal Road, Springfield, VA 22161. Scott, Thomas G.; Wasser, Clinton H. 1980. Checklist of North American plants for wildlife biologists. Washington, DC: The Wildlife Society. 58 p. Shields, Lora M.; Wells, Philip V.; Rickard, William H. 1963. Vegetational recovery on atomic target areas in Nevada. Ecology. 44(4): 697-705. Wiersma, G. B. 1990. Conceptual basis for environmental monitoring programs. Journal of Toxicological and Environmental Chemistry. 27(4): 241-249. Vollmer, A. T.; Bamberg, S. A. 1975. Response of the desert shrub Krameria parvifolia after ten years of chronic gamma radiation. Radiation Botany. 15: 405-409. ACKNOWLEDGMENTS This work was performed under contract DE-AC0889NV10630 with the U.S. Department of Energy. We are grateful to the many officials who have supported ' ecological research on the Nevada Test Site over 40 years of testing. REFERENCES Allred, Dorald M.; Beck, D Elden; Jorgensen, Clive D. 1963a. Biotic communities of the Nevada Test Site. Brigham Young University Science Bulletin, Biological Series. 2(2): 1-52. Allred, Dorald M.; Beck, D Elden; Jorgensen, Clive D. 1963b. Close-in effects of an underground nuclear detonation on small mammals and selected invertebrates (Project SEDAN). U.S. Atomic Energy Commission, PNE-226 IV. 18 p. Beatley, Janice C. 1976. Vascular plants of the Nevada Test Site and Central-Southern Nevada: ecologic and geographic distributions. Energy Research and Development Administration, TID-26881. 308 p. Available from National Technical Information Service, U.S. Department of Commerce, 5285 Port Royal Road, Springfield, VA22161. Beatley, Janice C. 1979. Shrub and tree data for plant associations across the Mojave/Great Basin Desert 407
