Document 11857005
advertisement
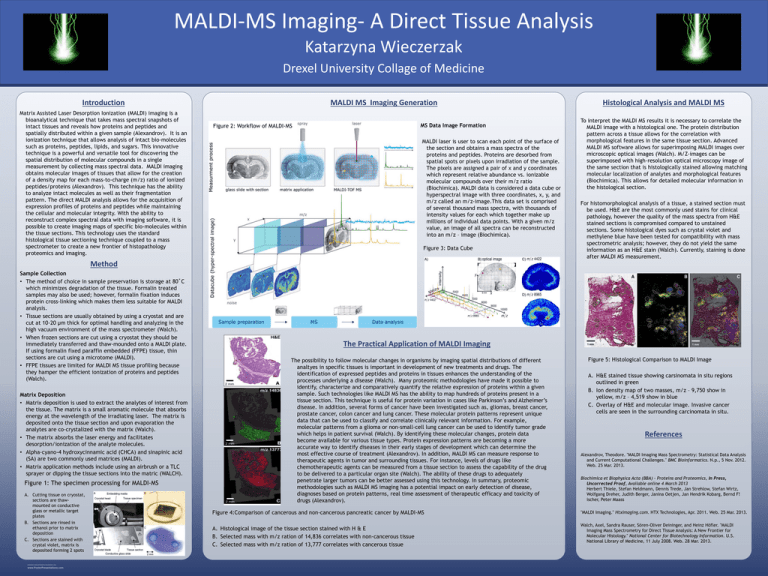
MALDI-MS Imaging- A Direct Tissue Analysis Katarzyna Wieczerzak Drexel University Collage of Medicine Introduction Matrix Assisted Laser Desorption Ionization (MALDI) imaging is a bioanalytical technique that takes mass spectral snapshots of intact tissues and reveals how proteins and peptides and spatially distributed within a given sample (Alexandrov). It is an ionization technique that allows analysis of intact bio-molecules such as proteins, peptides, lipids, and sugars. This innovative technique is a powerful and versatile tool for discovering the spatial distribution of molecular compounds in a single measurement by collecting mass spectral data. MALDI imaging obtains molecular images of tissues that allow for the creation of a density map for each mass-to-charge (m/z) ratio of ionized peptides/proteins (Alexandrov). This technique has the ability to analyze intact molecules as well as their fragmentation pattern. The direct MALDI analysis allows for the acquisition of expression profiles of proteins and peptides while maintaining the cellular and molecular integrity. With the ability to reconstruct complex spectral data with imaging software, it is possible to create imaging maps of specific bio-molecules within the tissue sections. This technology uses the standard histological tissue sectioning technique coupled to a mass spectrometer to create a new frontier of histopathology proteomics and imaging. MALDI MS Imaging Generation MS Data Image Formation Figure 2: Workflow of MALDI-MS MALDI laser is user to scan each point of the surface of the section and obtains a mass spectra of the proteins and peptides. Proteins are desorbed from spatial spots or pixels upon irradiation of the sample. The pixels are assigned a pair of x and y coordinates which represent relative abundance vs. ionizable molecular compounds over their m/z ratio (Biochimica). MALDI data is considered a data cube or hyperspectral image with three coordinates, x, y, and m/z called an m/z-image.This data set is comprised of several thousand mass spectra, with thousands of intensity values for each which together make up millions of individual data points. With a given m/z value, an image of all spectra can be reconstructed into an m/z – image (Biochimica). Figure 3: Data Cube Method Sample Collection • The method of choice in sample preservation is storage at 80˚C which minimizes degradation of the tissue. Formalin treated samples may also be used; however, formalin fixation induces protein cross-linking which makes them less suitable for MALDI analysis. • Tissue sections are usually obtained by using a cryostat and are cut at 10-20 µm thick for optimal handling and analyzing in the high vacuum environment of the mass spectrometer (Walch). • When frozen sections are cut using a cryostat they should be immediately transferred and thaw-mounded onto a MALDI plate. If using formalin fixed paraffin embedded (FFPE) tissue, thin sections are cut using a microtome (MALDI). • FFPE tissues are limited for MALDI MS tissue profiling because they hamper the efficient ionization of proteins and peptides (Walch). Matrix Deposition • Matrix deposition is used to extract the analytes of interest from the tissue. The matrix is a small aromatic molecule that absorbs energy at the wavelength of the irradiating laser. The matrix is deposited onto the tissue section and upon evaporation the analytes are co-crystalized with the matrix (Walch). • The matrix absorbs the laser energy and facilitates desorption/ionization of the analyte molecules. • Alpha-cyano-4 hydroxycinnamic acid (CHCA) and sinapinic acid (SA) are two commonly used matrices (MALDI). • Matrix application methods include using an airbrush or a TLC sprayer or dipping the tissue sections into the matric (WALCH). Figure 1: The specimen processing for MALDI-MS A. Cutting tissue on cryostat, sections are thawmounted on conductive glass or metallic target plates B. Sections are rinsed in ethanol prior to matrix deposition C. Sections are stained with crystal violet, matrix is deposited forming 2 spots RESEARCH POSTER PRESENTATION DESIGN © 2012 www.PosterPresentations.com Histological Analysis and MALDI MS To interpret the MALDI MS results it is necessary to correlate the MALDI image with a histological one. The protein distribution pattern across a tissue allows for the correlation with morphological features in the same tissue section. Advanced MALDI MS software allows for superimposing MALDI images over microscopic optical images (Walch). M/Z-images can be superimposed with high-resolution optical microscopy image of the same section that is histologically stained allowing matching molecular localization of analytes and morphological features (Biochimica). This allows for detailed molecular information in the histological section. For histomorphological analysis of a tissue, a stained section must be used. H&E are the most commonly used stains for clinical pathology, however the quality of the mass spectra from H&E stained sections is compromised compared to unstained sections. Some histological dyes such as crystal violet and methylene blue have been tested for compatibility with mass spectrometric analysis; however, they do not yield the same information as an H&E stain (Walch). Currently, staining is done after MALDI MS measurement. The Practical Application of MALDI Imaging The possibility to follow molecular changes in organisms by imaging spatial distributions of different analtyes in specific tissues is important in development of new treatments and drugs. The identification of expressed peptides and proteins in tissues enhances the understanding of the processes underlying a disease (Walch). Many proteomic methodologies have made it possible to identify, characterize and comparatively quantify the relative expression of proteins within a given sample. Such technologies like MALDI MS has the ability to map hundreds of proteins present in a tissue section. This technique is useful for protein variation in cases like Parkinson’s and Alzheimer’s disease. In addition, several forms of cancer have been investigated such as, gliomas, breast cancer, prostate cancer, colon cancer and lung cancer. These molecular protein patterns represent unique data that can be used to classify and correlate clinically relevant information. For example, molecular patterns from a glioma or non-small-cell lung cancer can be used to identify tumor grade which helps in patient survival (Walch). By identifying these molecular changes, protein data become available for various tissue types. Protein expression patterns are becoming a more accurate way to identify diseases in their early stages of development which can determine the most effective course of treatment (Alexandrov). In addition, MALDI MS can measure response to therapeutic agents in tumor and surrounding tissues. For instance, levels of drugs like chemotherapeutic agents can be measured from a tissue section to assess the capability of the drug to be delivered to a particular organ site (Walch). The ability of these drugs to adequately penetrate larger tumors can be better assessed using this technology. In summary, proteomic methodologies such as MALDI MS imaging has a potential impact on early detection of disease, diagnoses based on protein patterns, real time assessment of therapeutic efficacy and toxicity of drugs (Alexandrov). Figure 4:Comparison of cancerous and non-cancerous pancreatic cancer by MALDI-MS A. Histological image of the tissue section stained with H & E B. Selected mass with m/z ration of 14,836 correlates with non-cancerous tissue C. Selected mass with m/z ration of 13,777 correlates with cancerous tissue Figure 5: Histological Comparison to MALDI Image A. H&E stained tissue showing carsinomata in situ regions outlined in green B. Ion density map of two masses, m/z – 9,750 show in yellow, m/z – 4,519 show in blue C. Overlay of H&E and molecular image. Invasive cancer cells are seen in the surrounding carcinomata in situ. References Alexandrov, Theodore. "MALDI Imaging Mass Spectrometry: Statistical Data Analysis and Current Computational Challenges." BMC Bioinformatics. N.p., 5 Nov. 2012. Web. 25 Mar. 2013. Biochimica et Biophysica Acta (BBA) - Proteins and Proteomics, In Press, Uncorrected Proof, Available online 4 March 2013 Herbert Thiele, Stefan Heldmann, Dennis Trede, Jan Strehlow, Stefan Wirtz, Wolfgang Dreher, Judith Berger, Janina Oetjen, Jan Hendrik Kobarg, Bernd F! ischer, Peter Maass "MALDI Imaging." Htximaging.com. HTX Technologies, Apr. 2011. Web. 25 Mar. 2013. Walch, Axel, Sandra Rauser, Sören-Oliver Deininger, and Heinz Höfler. "MALDI Imaging Mass Spectrometry for Direct Tissue Analysis: A New Frontier for Molecular Histology." National Center for Biotechnology Information. U.S. National Library of Medicine, 11 July 2008. Web. 28 Mar. 2013.
