Mapping savanna tree species using Carnegie Airborne Observatory hyperspectral data
advertisement
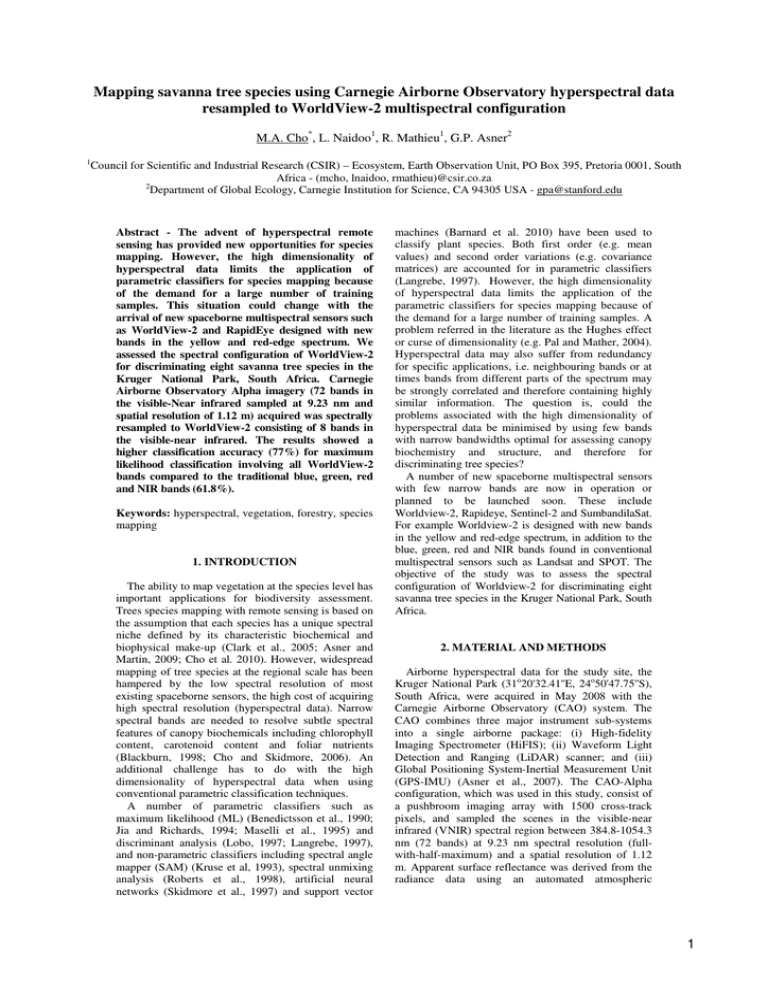
Mapping savanna tree species using Carnegie Airborne Observatory hyperspectral data resampled to WorldView-2 multispectral configuration M.A. Cho*, L. Naidoo1, R. Mathieu1, G.P. Asner2 1 Council for Scientific and Industrial Research (CSIR) – Ecosystem, Earth Observation Unit, PO Box 395, Pretoria 0001, South Africa - (mcho, lnaidoo, rmathieu)@csir.co.za 2 Department of Global Ecology, Carnegie Institution for Science, CA 94305 USA - gpa@stanford.edu Abstract - The advent of hyperspectral remote sensing has provided new opportunities for species mapping. However, the high dimensionality of hyperspectral data limits the application of parametric classifiers for species mapping because of the demand for a large number of training samples. This situation could change with the arrival of new spaceborne multispectral sensors such as WorldView-2 and RapidEye designed with new bands in the yellow and red-edge spectrum. We assessed the spectral configuration of WorldView-2 for discriminating eight savanna tree species in the Kruger National Park, South Africa. Carnegie Airborne Observatory Alpha imagery (72 bands in the visible-Near infrared sampled at 9.23 nm and spatial resolution of 1.12 m) acquired was spectrally resampled to WorldView-2 consisting of 8 bands in the visible-near infrared. The results showed a higher classification accuracy (77%) for maximum likelihood classification involving all WorldView-2 bands compared to the traditional blue, green, red and NIR bands (61.8%). Keywords: hyperspectral, vegetation, forestry, species mapping 1. INTRODUCTION The ability to map vegetation at the species level has important applications for biodiversity assessment. Trees species mapping with remote sensing is based on the assumption that each species has a unique spectral niche defined by its characteristic biochemical and biophysical make-up (Clark et al., 2005; Asner and Martin, 2009; Cho et al. 2010). However, widespread mapping of tree species at the regional scale has been hampered by the low spectral resolution of most existing spaceborne sensors, the high cost of acquiring high spectral resolution (hyperspectral data). Narrow spectral bands are needed to resolve subtle spectral features of canopy biochemicals including chlorophyll content, carotenoid content and foliar nutrients (Blackburn, 1998; Cho and Skidmore, 2006). An additional challenge has to do with the high dimensionality of hyperspectral data when using conventional parametric classification techniques. A number of parametric classifiers such as maximum likelihood (ML) (Benedictsson et al., 1990; Jia and Richards, 1994; Maselli et al., 1995) and discriminant analysis (Lobo, 1997; Langrebe, 1997), and non-parametric classifiers including spectral angle mapper (SAM) (Kruse et al, 1993), spectral unmixing analysis (Roberts et al., 1998), artificial neural networks (Skidmore et al., 1997) and support vector machines (Barnard et al. 2010) have been used to classify plant species. Both first order (e.g. mean values) and second order variations (e.g. covariance matrices) are accounted for in parametric classifiers (Langrebe, 1997). However, the high dimensionality of hyperspectral data limits the application of the parametric classifiers for species mapping because of the demand for a large number of training samples. A problem referred in the literature as the Hughes effect or curse of dimensionality (e.g. Pal and Mather, 2004). Hyperspectral data may also suffer from redundancy for specific applications, i.e. neighbouring bands or at times bands from different parts of the spectrum may be strongly correlated and therefore containing highly similar information. The question is, could the problems associated with the high dimensionality of hyperspectral data be minimised by using few bands with narrow bandwidths optimal for assessing canopy biochemistry and structure, and therefore for discriminating tree species? A number of new spaceborne multispectral sensors with few narrow bands are now in operation or planned to be launched soon. These include Worldview-2, Rapideye, Sentinel-2 and SumbandilaSat. For example Worldview-2 is designed with new bands in the yellow and red-edge spectrum, in addition to the blue, green, red and NIR bands found in conventional multispectral sensors such as Landsat and SPOT. The objective of the study was to assess the spectral configuration of Worldview-2 for discriminating eight savanna tree species in the Kruger National Park, South Africa. 2. MATERIAL AND METHODS Airborne hyperspectral data for the study site, the Kruger National Park (31o20'32.41''E, 24o50'47.75''S), South Africa, were acquired in May 2008 with the Carnegie Airborne Observatory (CAO) system. The CAO combines three major instrument sub-systems into a single airborne package: (i) High-fidelity Imaging Spectrometer (HiFIS); (ii) Waveform Light Detection and Ranging (LiDAR) scanner; and (iii) Global Positioning System-Inertial Measurement Unit (GPS-IMU) (Asner et al., 2007). The CAO-Alpha configuration, which was used in this study, consist of a pushbroom imaging array with 1500 cross-track pixels, and sampled the scenes in the visible-near infrared (VNIR) spectral region between 384.8-1054.3 nm (72 bands) at 9.23 nm spectral resolution (fullwith-half-maximum) and a spatial resolution of 1.12 m. Apparent surface reflectance was derived from the radiance data using an automated atmospheric 1 correction model, ACORN 5LiBatch (Imspec LLC, Palmdale, CA). The Universal Transverse Mercator (UTM) coordinates of tree crowns (trees ≥ 2 m) were extracted from the image and downloaded into a mapping-grade Leica differential global positioning system (DGPS). Tree height data was derived from the LiDAR imagery. With the help of the GPS and printed true colour composite maps of the study site, the various trees were located and identified in the field. The GPS locations of other trees were recorded, particularly, coppices of Pterocarpus rotudifolius which are generally less than 2 m in height. Only the dominant trees have been used in this study; Combretum sp (dominated by C. apiculatum), Sclerocarya birrea, Terminalia sericea, Spirostachys africanus, Pterocarpus rotundifolius, Berchemia discolor, Dichrostachys cinerea, Acacia geradii and Acacia nigrescens. D. cinerea and A. geradii were combined in the analysis because of the intimate mixture of the two species in the study site. The region of interest tool in Environment for Visualising Images (ENVI 4.7) software (ITT Visual Information Solution, 2009) was used to manually create regions of interest for the tree crowns, The species data were split into the training and test data in about a 1:1 ratio (Table 1). Table 1. Training and test data used in the study. SB = Sclerocarya birrea, BD = Berchemia discolor, AG-DC = Acacia geradii and Dichrostachys cinerea, SA= Spirochys africanus, AN = Acacia nigrescens, Com = Combretums sp (dominated by C. apiculatum), TS = Terminalia sericea, PR = Pterocarpus rotundifolius. Number of trees Number of pixels (crowns) TrainTest TrainTest set ing set set ing set SB 38 35 843 773 BD 2 1 37 20 AG-DC 24 24 167 161 SA 17 19 294 349 AN 30 28 430 397 Com 39 32 278 208 TS 12 10 45 30 PR 10 10 104 90 The CAO images were spectrally resampled to the WorldView-2 band setting (8 spectral bands centred at 425, 480, 545, 605, 660, 725, 835, and 950 nm) (http://www.digitalglobe.com/downloads/spacecraft/W V1_WV2_SpectralResponse.pdf.). A tree mask was built from the resampled image using a combination of the LiDAR height data and NDVI thresholds. Subsequently, the classification of the tree species was conducted using the maximum likelihood classifier. 3. RESULTS AND DISCUSSION An overall classification accuracy of 77% (kappa coefficient = 0.71) was recorded for the ML classifier involving the WorldView-2 band setting. ML classification involving the traditional blue, green, red and NIR bands produced a lower overall accuracy (61.8%, kappa = 0.55). Higher accuracies were recorded for big trees (generally greater than 5 m tall) i.e. Sclerrocarya birrea, Acacia nigrescens and Sprirotachys africanus than small trees. The overall classification accuracy for the WorldView-2 band configuration improved to 82% (kappa coefficient = 0.77) when we applied a 3 by 3 post-classification majority filter, for the big trees only (Table 2). Figure 1 shows the distribution of some of the tree species that have important socioeconomic and ecological value to the area. S. birrea (marula tree) is widely distributed across the study area, show high densities around settlements and in the Sabie Sand reserve. The marula tree is preserved in this area by the indigenous people for its valuable fruit and shade (e.g. resting place in fields). The fruit, which is high in vitamin C, is utilised by humans and animals. A. nigrescens (knob thorn) is concentrated on the gabbro soils of the communal area and Sabie Sand. The occurrence of this species is generally associated with good ranching land. C. apiculatum (red bushwillow) is considered a bush encroaching species; it is also widely distributed in the area. The distribution of T. sericea (silver cluster-leaf) is limited to a few areas close to the settlements and on granite soils. Mostly coppices of the T. sericea were found on the ground as it tends to be over harvested as live fuelwood. This tree is one of the favourite fuelwood species and has many other uses including for making furniture, for fence posts, roots used for medicine and bark of young trees used as rope. Table 2. Confusion matrix obtained after classification of 8 savanna tree species using maximum likelihood classifier. SB = Sclerocarya birrea BD = Berchemia discolor, AG-DC = Acacia geradii and Dichrostachys cinerea, SA= Spirochys africanus, AN = Acacia nigrescens, Com = Combretums sp (dominated by C. apiculatum), TS = Terminalia sericea, PR = Pterocarpus rotundifolius. SB BD AG-DC SA AN Com TS PR Sum User accuracy Unclassified 9 0 4 0 14 33 2 6 68 SB 643 0 12 5 31 17 2 0 710 91 BD 0 18 0 4 0 5 0 0 27 67 AG-DC 58 0 141 22 2 10 0 17 250 56 SA 15 2 0 309 0 22 0 2 350 88 AN 10 0 1 0 346 0 0 0 357 97 Com 8 0 0 9 4 114 0 0 135 84 TS 29 0 0 0 0 0 26 0 55 47 PR 1 0 3 0 0 7 0 65 76 85 Sum 773 20 161 349 397 208 30 90 2028 Producer 83 90 88 88 87 55 87 72 accuracy 2 Figure 1. Maps showing the distribution of some important savanna tree species across a section of the greater Kruger National Park areas, from a private conservation area (Sabie Sand) on the right to the neighbouring communal areas of Justicia (Bushbuckridge) on the left. The Maps were produced by maximum likelihood classification of Carnegie Airborne Observatory (CAO) hyperspectral images of the area. 4. CONCLUSIONS The development of new spaceborne systems could prove crucial to the mapping of vegetation at the individual species level. This study has revealed the importance of the spectral band configuration of WorldView-2 for mapping individual tree species in in the Southern section of the greater Kruger National Park area, South Africa. Furthermore, the LiDAR was vital in building a tree mask from the data. Spectral data only were not adequate to discriminate A. nigrescens from the grass layer because of similar spectral signatures. Lastly, an approach that integrates the LiDAR height and the spectral information could improve the accuracy of tree species mapping. REFERENCES G. P. Asner, D. E. Knapp, M. O. Jones, T. KennedyBowdoin, J. B. Martin, R.E. , and C. B. Field, "Carnegie Airborne Observatory: In-flight fusion of hyperspectral imaging and waveform light detection and ranging (wLiDAR) for three-dimensional studies of ecosystems," Journal of Applied Remote Sensing, vol. 1, 2007. E. Barnard, M.A. Cho, P. Debba, R. Mathieu, K.Wessels, C.van Heerden, C.van der Walt, and G.P. Asner, “Optimizing tree species classification in hyperspectral images,” Proceedings of the Twenty-First Annual Symposium of the Pattern Recognition Association of South Africa, 22-23 November 2010, Stellenbosch, South Africa, Edited by F. Nicolls, p.p. 33-38, 2010. J. A. Benedictsson, P. H. Swain, and O. K. Ersoy, "Neural network approaches versus statistical methods in classification of multisource remote sensing data," IEEE Transactions on Geoscience and Remote Sensing, vol. 28, p.p. 540-551., 1990. G.A. Blackburn, “Quantifying chlorophylls and carotenoids from leaf to canopy scales: an evaluation of some hyperspectral approaches,” Remote Sensing of Environment, vol 66, p.p. 273285, 1998 M. A. Cho and A. K. Skidmore, "A new technique for extracting the red edge position from hyperspectral data: The linear extrapolation method," Remote Sensing of Environment, vol. 101, p.p. 181-193, 2006. M. L. Clark, D. A. Roberts, and D. B. Clark, "Hyperspectral discrimination of tropical rain forest tree species at leaf to crown scales," Remote Sensing of Environment, vol. 96, pp. 375-398, 2005. X. Jia and J. A. Richards, "Efficient maximum likelihood classification for imaging spectrometer data sets," IEEE Transactions on Geoscience and Remote Sensing, vol. 32, p.p. 274-281, 1994. F. A. Kruse, A. B. Lefkoff, J. W. Boardman, K. B. Heidebrecht, A. T. Shapiro, P. J. Barloon, and A. F. H. Goetz, "The spectral image processing system (SIPS)--interactive visualization and analysis of imaging spectrometer data," Remote Sensing of Environment, vol. 44, pp. 145-163, 1993. D. Landgrebe, "On information extraction principles for Hyperspectral data: A white paper," School of Electrical and Computer Engineering, Purdue University, West Lafayette IN p.p. 47907-1285, 1997. A. Lobo "Image segmentation and discriminant analysis for the identification of land cover units in ecology," IEEE Transactions on Geoscience and Remote Sensing, vol. 35, p.p. 1136–1145, 1997. F. Maselli, C. Conese, G. Zipoli, and M. A. Pittau, "Use of error probabilities to improve area estimates based on maximum likelihood classifications," Remote Sensing of Environment, vol. 31, p.p. 155160, 1990. M. Pal, P. M. Mather, “Assessment of the effectiveness of support vector machines for hyperspectral data, Future Generation Computer Systems”, Geocomputation, vol 20, p.p. 1215-1225, October 2004 D. A. Roberts, M. Gardner, R. Church, S. Ustin, G. Scheer, and R. O. Green, "Mapping chaparral in the Santa Monica Mountains using multiple endmember spectral mixture models," Remote Sensing of Environment vol. 65, pp. 267-279, 1998. A.K. Skidmore, B.J Turner, W.Brinkhof, and E. Knowles, “Performance of a neural network: mapping forest using GIS and remotely sensed data,” Photogrammetric Engineering and remote sensing, vol 63, p.p. 501-514, 1997. ACKNOWLEDGEMENTS 3 We acknowledge the Council for Scientific and Industrial Research (CSIR), South Africa for proving the funding for the study. Hyperspectral and LiDAR imagery were supplied by the Carnegie Airborne Observatory, which is funded by the Andrew Mellon Foundation. The CAO system is further supported by the W.M. Keck Foundation, the Gordon and Betty Moore Foundation and William Hearst III. Data were preprocessed by T. Kennedy-Bowdoin, D. Knapp, J. Jacobson and R. Emerson at the Carnegie Institution for Science. Drs, Barend Erasmus and Konrad Wessels provided research inputs in the project. Dr. Izak Smith of the Kruger National Park provided valuable logistic support. 4

