EXTRACTING CROPPING INDEX VARIATIONS IN NORTHERN CHINA BASED ON NDVI
advertisement
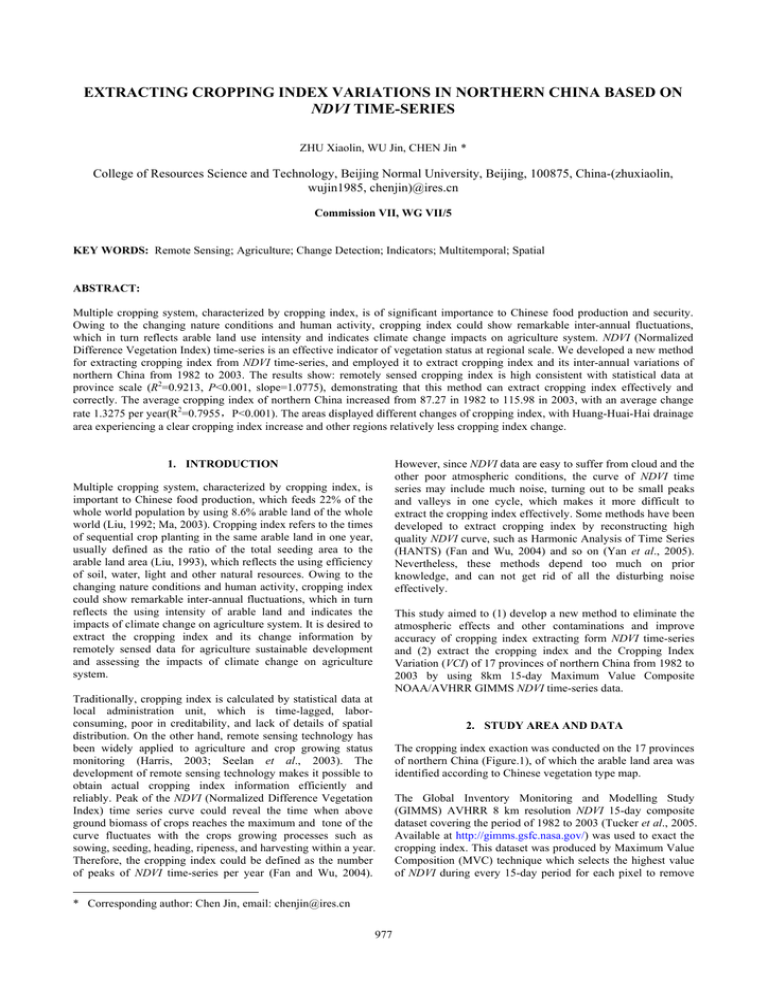
EXTRACTING CROPPING INDEX VARIATIONS IN NORTHERN CHINA BASED ON
NDVI TIME-SERIES
ZHU Xiaolin, WU Jin, CHEN Jin *
College of Resources Science and Technology, Beijing Normal University, Beijing, 100875, China-(zhuxiaolin,
wujin1985, chenjin)@ires.cn
Commission VII, WG VII/5
KEY WORDS: Remote Sensing; Agriculture; Change Detection; Indicators; Multitemporal; Spatial
ABSTRACT:
Multiple cropping system, characterized by cropping index, is of significant importance to Chinese food production and security.
Owing to the changing nature conditions and human activity, cropping index could show remarkable inter-annual fluctuations,
which in turn reflects arable land use intensity and indicates climate change impacts on agriculture system. NDVI (Normalized
Difference Vegetation Index) time-series is an effective indicator of vegetation status at regional scale. We developed a new method
for extracting cropping index from NDVI time-series, and employed it to extract cropping index and its inter-annual variations of
northern China from 1982 to 2003. The results show: remotely sensed cropping index is high consistent with statistical data at
province scale (R2=0.9213, P<0.001, slope=1.0775), demonstrating that this method can extract cropping index effectively and
correctly. The average cropping index of northern China increased from 87.27 in 1982 to 115.98 in 2003, with an average change
rate 1.3275 per year(R2=0.7955,P<0.001). The areas displayed different changes of cropping index, with Huang-Huai-Hai drainage
area experiencing a clear cropping index increase and other regions relatively less cropping index change.
However, since NDVI data are easy to suffer from cloud and the
other poor atmospheric conditions, the curve of NDVI time
series may include much noise, turning out to be small peaks
and valleys in one cycle, which makes it more difficult to
extract the cropping index effectively. Some methods have been
developed to extract cropping index by reconstructing high
quality NDVI curve, such as Harmonic Analysis of Time Series
(HANTS) (Fan and Wu, 2004) and so on (Yan et al., 2005).
Nevertheless, these methods depend too much on prior
knowledge, and can not get rid of all the disturbing noise
effectively.
1. INTRODUCTION
Multiple cropping system, characterized by cropping index, is
important to Chinese food production, which feeds 22% of the
whole world population by using 8.6% arable land of the whole
world (Liu, 1992; Ma, 2003). Cropping index refers to the times
of sequential crop planting in the same arable land in one year,
usually defined as the ratio of the total seeding area to the
arable land area (Liu, 1993), which reflects the using efficiency
of soil, water, light and other natural resources. Owing to the
changing nature conditions and human activity, cropping index
could show remarkable inter-annual fluctuations, which in turn
reflects the using intensity of arable land and indicates the
impacts of climate change on agriculture system. It is desired to
extract the cropping index and its change information by
remotely sensed data for agriculture sustainable development
and assessing the impacts of climate change on agriculture
system.
This study aimed to (1) develop a new method to eliminate the
atmospheric effects and other contaminations and improve
accuracy of cropping index extracting form NDVI time-series
and (2) extract the cropping index and the Cropping Index
Variation (VCI) of 17 provinces of northern China from 1982 to
2003 by using 8km 15-day Maximum Value Composite
NOAA/AVHRR GIMMS NDVI time-series data.
Traditionally, cropping index is calculated by statistical data at
local administration unit, which is time-lagged, laborconsuming, poor in creditability, and lack of details of spatial
distribution. On the other hand, remote sensing technology has
been widely applied to agriculture and crop growing status
monitoring (Harris, 2003; Seelan et al., 2003). The
development of remote sensing technology makes it possible to
obtain actual cropping index information efficiently and
reliably. Peak of the NDVI (Normalized Difference Vegetation
Index) time series curve could reveal the time when above
ground biomass of crops reaches the maximum and tone of the
curve fluctuates with the crops growing processes such as
sowing, seeding, heading, ripeness, and harvesting within a year.
Therefore, the cropping index could be defined as the number
of peaks of NDVI time-series per year (Fan and Wu, 2004).
* Corresponding author: Chen Jin, email: chenjin@ires.cn
977
2. STUDY AREA AND DATA
The cropping index exaction was conducted on the 17 provinces
of northern China (Figure.1), of which the arable land area was
identified according to Chinese vegetation type map.
The Global Inventory Monitoring and Modelling Study
(GIMMS) AVHRR 8 km resolution NDVI 15-day composite
dataset covering the period of 1982 to 2003 (Tucker et al., 2005.
Available at http://gimms.gsfc.nasa.gov/) was used to exact the
cropping index. This dataset was produced by Maximum Value
Composition (MVC) technique which selects the highest value
of NDVI during every 15-day period for each pixel to remove
The International Archives of the Photogrammetry, Remote Sensing and Spatial Information Sciences. Vol. XXXVII. Part B7. Beijing 2008
Gb : the difference between a peak value and the nearest
forward wave trough.
Based on above variables, a wave packet meeting equation (1)
is identified as “one-cropping”. Then the remotely sensed
cropping index (CI) is defined as the number of peaks of the
NDVI time-series multiplies 100% which accord with the
definition of “once cropping”.
most of the cloudy contamination (Holben, 1986). Beside that,
particular efforts were made to the GIMMS dataset including a
correction of varying solar zenith angles due to orbital drift of
the afternoon NOAA satellites and a correction of volcano
aerosols (Vermote et al., 1997) emitted by El Chichón from
March to April 1982 and Mount Pinatubo in June 1991. It is
reported that the GIMMS dataset has high quality (Fensholt et
al., 2006; Tucker et al., 2005).
λ ≥9
G f ≥ P × 50%
(1)
Gb ≥ P × 50%
1Heilongjiang, 2inter-Mongolia, 3Xinjiang,
4Jilin, 5Liaoning, 6Gansu, 7Hebei, 8Beijing,
9Shanxi, 10Tianjin, 11Qinghai, 12Shaanxi,
13Ningxia, 14Shandong, 15Henan, 16Jiangsu,
17Anhui
1
3.2 The Method of Cropping Index extracting
4
8
arable land
As presented in Figure.3, the cropping index extracting
procedure includes data preprocessing (step1, step2), false
peaks correcting (step3, step4), and CI extracting (step5, step6).
5
2
10
3
7
9
6
NDVI time-series
15
17
12
11
14
16
13
Cloud flag for each NDVI point
Step 1
Linear interpolation of Cloudy NDVI values
Step 2
Growing trend fitting by Savitzky-Golay filter
Step 3
Finding the peaks by Twi-difference Algorithm
Figure.1 Study area
Step 4
Seeking the false peaks in the NDVI
curve based on the definition of onecropping and counting the number
of false peaks ‘N’
Linear
interpolation
of the false
peaks
3. METHORDS
Yes
Step 5
Based on the fact that the growing length of the mainly crops in
China was above 90 days, the definition of one-cropping was
“the crop with 3 months growing length and full coverage of the
farm” (Liu, 1997). Four parameters were used to characterize
the wave of “once cropping” in an NDVI curve (Figure.2).
Step 6
NDVI
Calculating cropping index in administration units
Step 1:Linear interpolation of cloudy NDVI values
In this study, cloud flag data were used to improve the NDVI
time-series by linear interpolation of the cloudy NDVI values
(labelled ● in Figure.4(a)).
0.6
Step 2:Growing trend fitting by Savitzky-Golay filter
This step was done exactly as reported in Chen et al. (2004).
Figure.4(b) shows a growing trend curve obtained using this
filter.
Gb
Gf
Exporting the cropping index of each pixel
Figure.3 Flowchart of cropping index extracting procedure
0.7
0.5
No
N=0
3.1 Definition of the NDVI Time-series Based Cropping
Index
0.4
Step 3:Finding the peaks by Twi-difference Algorithm
The twi-difference algorithm used in this step is as follows: a
new time-series {S2} was calculated following equation (2).
λ
0.3
0.2
0
2
4
6
8
10
12
14
16
18
20
22
S1i = 1, if NDVI i −1 > NDVI i
24
S1i = −1, if NDVI i −1 < NDVI i
time/(15 days)
(2)
S 2i = S1i − S1i +1
Figure.2 NDVI profile of crop
Amplitude P: the difference between maximal NDVI and
minimal NDVI of a certain pixel within one year.
Growing length λ: the interval between the nearest two wave
troughs in the NDVI curve.
Gf : the difference between a peak value and the nearest
backward wave trough.
Where i denotes the ith point in the NDVI time-series. Where
S2i equals -2 was recognized as a peak, and 2 a trough.
978
The International Archives of the Photogrammetry, Remote Sensing and Spatial Information Sciences. Vol. XXXVII. Part B7. Beijing 2008
4. RESULTS AND DISCUSSION
Step 4:Elimination of false peaks in the NDVI curve based
on the definition of one-cropping and counting the number
of false peaks ‘N’
λ, Gf, Gb of each wave packet can be calculated when all the
peaks and troughs were recognized in step 3, and then false
peaks were identified according to the definition of “onecropping” and the number of the false peaks (N) was counted .If
N is zero, the correcting of NDVI time-series will finish
(Figure.4(c)), and then do step5. Otherwise, replace the false
peaks by linearly interpolated values and return to step3.
4.1 Precision Evaluation
Precision evaluation was carried out as the comparison between
the CI extracted trough our new method and that calculated
from statistical data at province scale. As mentioned above,
cropping index is defined as the ratio of the total seeding area to
the arable land area. Annual seeding area of every year during
1982 to 2003 is available in “China Agriculture Information
Net” (http://www.agri.gov.cn/sjzl/ nongyety.htm). However,
there is no available data about arable land area of each year, so
the arable land area in 1996 could be approximately regarded as
the arable land area from 1996 to 2003 (also available in China
Agriculture Information Net). Based on the statistical data
above, the annual CI of each province was calculated.
Generally, the remotely sensed cropping index shows high
accordance with statistical data at province scale (R2=0.9213,
P<0.001, slope=1.0775) (Figure.5), suggesting the reliability of
the proposed method.
0.9
0.8
a
0.7
NDVI
0.6
0.5
0.4
0.3
0.2
0.1
0
0
12
24
36
48
60
72
84
time/(15 days)
96
108
120
132
144
0.9
0.8
190
b
remote sensed CI
0.7
NDVI
0.6
0.5
0.4
0.3
0.2
0.1
0
0
12
24
36
48
60
72
84
96
time/(15 days)
108
120
132
150
130
110
90
y = 1.0775x - 2.7166
70
R = 0.9213, P <0.001
2
144
50
0.9
50
c
0.8
the line of regression
170
70
0.6
NDVI
90
110
130
150
170
190
statistical CI
0.7
Figure. 5 Correlation of remotely sensed CI and statistical CI
0.5
0.4
0.3
4.2 Spatial Pattern of Cropping Index
0.2
0.1
The 22-year average CI varied evidently among different
provinces (Table 1), with Hebei, Shandong, Henan, Jiangsu,
Anhui exhibiting high values, and Heilongjiang, inter-Mongolia,
Xinjiang, Gansu, Shanxi, Qinghai, Ningxia exhibiting relatively
lower values. As presented in Figure.6, the cropping index
shows an increasing trend from northeastern and northwestern
provinces (about 100) to southeastern ones (about 200). The
spatial distribution of cropping index extracted by the newly
proposed method was consistent with the actual Chinese
cropping system reported by Shen et al. (1983).
0
0
12
24
36
48
60
72
84
96
time/(15 days)
108
120
132
144
Figure.4 Data processing of NDVI time series
Step 5:Exporting the cropping index of each pixel
The cropping index of ith pixel is “CIi =M×100”, where M is
the number of “once cropping” waves.
Step 6:Calculating cropping index in administration units
Average CI of certain administration unit can be calculated
following equation (3):
n
CI =
∑ CI
Province
i
i
(3)
Heilongjiang
interM
li
Xinjiang
n
Where n in the above expression is the number of the total
arable land pixels in the administration unit.
Average cropping index from 1982 to
2003
88.99
73.61
79.56
Jilin
90.43
Liaoning
91.88
3.3 The Method of Cropping Index Variation Extracting
Gansu
83.04
Since cropping anomalies often occurred during 1982-2003, the
Least Absolute Deviation (LAD) linear regression was
employed instead of Ordinary Least Square (OLS) regression to
calculate the change trend of cropping index (VCI) during 19822003. Comparing to OLS, LAD could reduce the sensitivity to
outliers effectively and provide a robust and plausible estimate.
The detailed information about LAD regression can be found in
Powell (1984).
Hebei
123.34
Beijing
107.99
Shanxi
87.13
979
Tianjin
104.68
Qinghai
77.07
Shaanxi
95.32
Ningxia
73.78
The International Archives of the Photogrammetry, Remote Sensing and Spatial Information Sciences. Vol. XXXVII. Part B7. Beijing 2008
Shandong
128.56
Henan
156.79
Jiangsu
143.83
Anhui
140.92
total
106.83
Figure.7 The variation of total northern China cropping index
from 1982 to 2003
Coefficient
R2
P
Heilongjiang
0.394
0.129
0.100
inter-Mongolia
1.629
0.596
0.000
Xinjiang
0.630
0.567
0.000
Jilin
-0.067
0.115
0.123
Liaoning
0.000
0.000
0.990
Gansu
0.603
0.165
0.061
Hebei
2.686
0.628
0.000
Beijing
1.914
0.375
0.002
Shanxi
0.028
0.001
0.912
Tianjin
1.134
0.375
0.002
Qinghai
0.423
0.127
0.104
Shaanxi
0.617
0.103
0.146
Ningxia
-0.009
0.000
0.977
Shandong
3.044
0.673
0.000
Henan
2.236
0.637
0.000
Jiangsu
2.618
0.462
0.001
Anhui
1.938
0.483
0.000
Table1. The average cropping index of each province from
1982 to 2003
1982
1990
2003
1997
Table 2. The regression coefficient of each province cropping
index from 1982 to 2003
60
CI=200
CI=100
50
non-arable land
percent(%)
CI=0
Fig.6 The spatial distribution of the cropping index in Northern
China in1982, 1990, 1997, and 2003
4.3 Cropping Index Change Trends
40
decreasing
increasing
30
71.62
20
2.43
10
25.95
0
The change trends for cropping index are shown in figure 7,
figure 8, figure 9, and table 2.The northern China experienced
an obvious cropping index increase, from 87.27 in 1982 to
115.98 in 2003 with an average change rate 1.3275 per
year(R2=0.7955,P<0.001) (Figure 7). Inter-Mongolia, Hebei,
Shandong, Henan, Jiangsu, Anhui experienced most significant
increase, comparatively, Liaoning, Shanxi, Ningxia no
significant increase (Table 2). From the histogram of VCI
(Figure 8), about 25.95 percent pixels of the whole arable land
in northern China had positive values greater than 2, indicating
an increase of cropping index. On the contrary, only 2.43
percent had negative VCI less than -2, and the rest 71.62
percent falls into the interval [-2, 2]. Figure 9 shows the spatial
distribution of VCI. During these 22 years, a large increase in
CI happened in Huang-Huai-Hai drainage area, a large decrease
in a small quantity of pixels of Henan and Shanxi provinces,
and no visible changes in other regions.
-12 -10 -8
-6
-4
-2
0
2
4
6
8
10 12
VCI
Figure.8 Histogram of cropping index change trends
cropping index
130
120
VCI<-2
110
100
2
R = 0.7955
80
1982
1985
1988
1991
1994
1997
2000
VCI>2
Figure.9 The spatial distribution of cropping index change trend
during 1982-2003
y = 1.3275x - 2538.3
90
-2<VCI<2
2003
year
980
The International Archives of the Photogrammetry, Remote Sensing and Spatial Information Sciences. Vol. XXXVII. Part B7. Beijing 2008
Liu Xunhao, 1993. Cropping System in China. Beijing,
Agricultural Press, pp. 12-15.
5. CONCLUSION
Based on the understanding and definition of cropping index by
remote sensing data, this study developed a method for
extracting cropping index based on NDVI time-series. This
method could correct cloud and other contaminations
effectively. The most important part of this new method is
circular correcting of curve based on the definition of “onecropping”. By applying this new method to GIMMS NDVI data,
the cropping index of 17 provinces of northern China from
1982 to 2003 was extracted, and then the Cropping Index
Variation of every arable land pixel during these 22 years was
calculated by the Least Absolute Deviation linear regression
method. The high accordance between remotely sensed
cropping index data and statistical data suggests that this
method could provide an effective way to extract spatial
information of cropping index.
Liu Xunhao, 1997. Study on potential of multi-cropping index
of arable land in China. Crop Magazine, 3, pp. 1-3.
Ma Yongxiang, 2003. Multi-cropping index discussion. Crop
Magazine, 4, pp. 54.
Powell, J. L., 1984. Least absolute deviations estimation for the
censored regression model, Journal of Econometrics, 25, pp.
303-325.
Seelan, S. K., Laguette, S., Casady, G. M., Seielstad, G. A,
2003. Remote sensing applications for precision agriculture: A
learning community approach. Remote Sensing of Environment,
88(1-2), pp. 157-169.
Shen Xuenian, Liu Xunhao, 1983. More Ripeness Cultivation.
Beijing, Agriculture Press, pp. 9-15.
Northern China experienced a cropping index increase from
1982 to 2003, and VCI varies among different regions, with
Huang-Huai-Hai drainage area experiencing a clear cropping
index increase and other regions relatively less cropping index
change. These results imply that it is possible to improve the
food production of limited arable land by enhancing the
cropping index. This is of value for regions and countries where
food production suffers from arable land decrease along with
economic growth.
Tucker, C., Pinzon, J., Brown, M., Slayback, D., Pak, E.,
Mahoney, R., Vermote, E., Saleous N. El., 2005. An extended
AVHRR 8-km NDVI dataset compatible with MODIS and
SPOT vegetation NDVI data. International Journal of Remote
Sensing, 26 (20), pp. 4485-4498.
Vermote, E., Saleous N. El., Kaufman Y. J., Dutton E., 1997.
Data pre-processing: stratospheric aerosol perturbing effect on
the remote sensing of vegetation: correction method for the
composite NDVI after the Pinatubo eruption. Remote Sensing
Reviews, 15, pp. 7-21.
ACKNOWLEDGEMENTS
This work was supported by the Hi-tech Research and
Development Program of China (863 program) under Grant
2006AA12Z103.
Yan Huimin, Cao Mingkui, Liu Jiyuan, et al., 2005.
Characterizing spatial patterns of multiple cropping system in
China from multi-temporal remote sensing images.
Transactions of the CSAE, 21(4), pp. 85-90.
REFERENCES
Chen J., Jönsson P., Tamura M., Gu Z., Matsushita B., Eklundh
L., 2004. A simple method for reconstructing a high-quality
NDVI time-series data set based on the Savitzky-Golay filter.
Remote Sensing of Environment, 91, pp. 332-344.
Fan Jinlong, Wu Bingfang, 2004. A methodology for retrieving
cropping index from NDVI profile. Journal of Remote Sensing,
8(6), pp. 628-636.
Fensholt, R., Nielsen, T. T., Stisen, S., 2006. Evaluation of
AVHRR PAL and GIMMS 10-day composite NDVI time series
products using SPOT-4 vegetation data for the African
continent. International Journal of Remote Sensing, 27 (13), pp.
2719-2733.
Harris, R., 2003. Remote sensing of agriculture change in Oman.
International Journal of Remote Sensing, 24(23), pp. 48354852.
Holben, B. N., 1986. Characteristics of maximum-value
composite images from temporal AVHRR data. International
Journal of Remote Sensing, 7, pp. 1417-1434.
Liu Xunhao, 1992. The view of Chinese Cropping System in
1990s. Cultivate and Plant, 2, pp. 1-9.
981
The International Archives of the Photogrammetry, Remote Sensing and Spatial Information Sciences. Vol. XXXVII. Part B7. Beijing 2008
982
