DEMs Created from Airborne IFSAR – An Update
advertisement
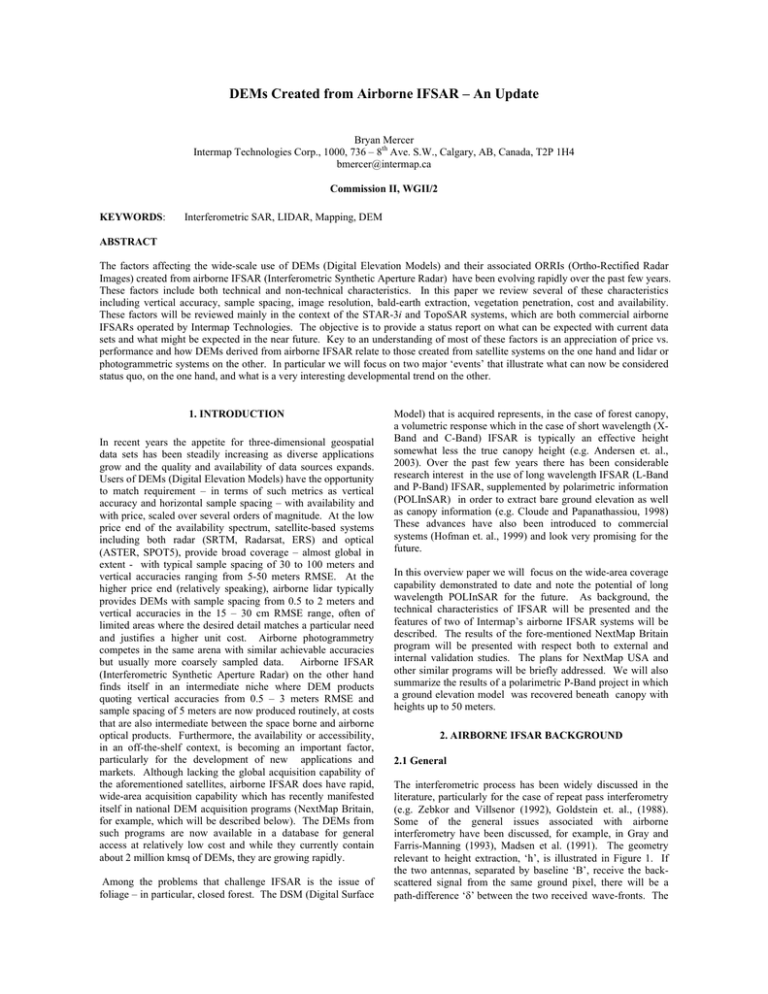
DEMs Created from Airborne IFSAR – An Update Bryan Mercer Intermap Technologies Corp., 1000, 736 – 8th Ave. S.W., Calgary, AB, Canada, T2P 1H4 bmercer@intermap.ca Commission II, WGII/2 KEYWORDS: Interferometric SAR, LIDAR, Mapping, DEM ABSTRACT The factors affecting the wide-scale use of DEMs (Digital Elevation Models) and their associated ORRIs (Ortho-Rectified Radar Images) created from airborne IFSAR (Interferometric Synthetic Aperture Radar) have been evolving rapidly over the past few years. These factors include both technical and non-technical characteristics. In this paper we review several of these characteristics including vertical accuracy, sample spacing, image resolution, bald-earth extraction, vegetation penetration, cost and availability. These factors will be reviewed mainly in the context of the STAR-3i and TopoSAR systems, which are both commercial airborne IFSARs operated by Intermap Technologies. The objective is to provide a status report on what can be expected with current data sets and what might be expected in the near future. Key to an understanding of most of these factors is an appreciation of price vs. performance and how DEMs derived from airborne IFSAR relate to those created from satellite systems on the one hand and lidar or photogrammetric systems on the other. In particular we will focus on two major ‘events’ that illustrate what can now be considered status quo, on the one hand, and what is a very interesting developmental trend on the other. 1. INTRODUCTION In recent years the appetite for three-dimensional geospatial data sets has been steadily increasing as diverse applications grow and the quality and availability of data sources expands. Users of DEMs (Digital Elevation Models) have the opportunity to match requirement – in terms of such metrics as vertical accuracy and horizontal sample spacing – with availability and with price, scaled over several orders of magnitude. At the low price end of the availability spectrum, satellite-based systems including both radar (SRTM, Radarsat, ERS) and optical (ASTER, SPOT5), provide broad coverage – almost global in extent - with typical sample spacing of 30 to 100 meters and vertical accuracies ranging from 5-50 meters RMSE. At the higher price end (relatively speaking), airborne lidar typically provides DEMs with sample spacing from 0.5 to 2 meters and vertical accuracies in the 15 – 30 cm RMSE range, often of limited areas where the desired detail matches a particular need and justifies a higher unit cost. Airborne photogrammetry competes in the same arena with similar achievable accuracies but usually more coarsely sampled data. Airborne IFSAR (Interferometric Synthetic Aperture Radar) on the other hand finds itself in an intermediate niche where DEM products quoting vertical accuracies from 0.5 – 3 meters RMSE and sample spacing of 5 meters are now produced routinely, at costs that are also intermediate between the space borne and airborne optical products. Furthermore, the availability or accessibility, in an off-the-shelf context, is becoming an important factor, particularly for the development of new applications and markets. Although lacking the global acquisition capability of the aforementioned satellites, airborne IFSAR does have rapid, wide-area acquisition capability which has recently manifested itself in national DEM acquisition programs (NextMap Britain, for example, which will be described below). The DEMs from such programs are now available in a database for general access at relatively low cost and while they currently contain about 2 million kmsq of DEMs, they are growing rapidly. Among the problems that challenge IFSAR is the issue of foliage – in particular, closed forest. The DSM (Digital Surface Model) that is acquired represents, in the case of forest canopy, a volumetric response which in the case of short wavelength (XBand and C-Band) IFSAR is typically an effective height somewhat less the true canopy height (e.g. Andersen et. al., 2003). Over the past few years there has been considerable research interest in the use of long wavelength IFSAR (L-Band and P-Band) IFSAR, supplemented by polarimetric information (POLInSAR) in order to extract bare ground elevation as well as canopy information (e.g. Cloude and Papanathassiou, 1998) These advances have also been introduced to commercial systems (Hofman et. al., 1999) and look very promising for the future. In this overview paper we will focus on the wide-area coverage capability demonstrated to date and note the potential of long wavelength POLInSAR for the future. As background, the technical characteristics of IFSAR will be presented and the features of two of Intermap’s airborne IFSAR systems will be described. The results of the fore-mentioned NextMap Britain program will be presented with respect both to external and internal validation studies. The plans for NextMap USA and other similar programs will be briefly addressed. We will also summarize the results of a polarimetric P-Band project in which a ground elevation model was recovered beneath canopy with heights up to 50 meters. 2. AIRBORNE IFSAR BACKGROUND 2.1 General The interferometric process has been widely discussed in the literature, particularly for the case of repeat pass interferometry (e.g. Zebkor and Villsenor (1992), Goldstein et. al., (1988). Some of the general issues associated with airborne interferometry have been discussed, for example, in Gray and Farris-Manning (1993), Madsen et al. (1991). The geometry relevant to height extraction, ‘h’, is illustrated in Figure 1. If the two antennas, separated by baseline ‘B’, receive the backscattered signal from the same ground pixel, there will be a path-difference ‘δ’ between the two received wave-fronts. The baseline angle ‘θb’ is obtainable from the aircraft inertial system, the aircraft height is known from differential GPS and the distance from antenna to pixel is the radar slant range. Then it is simple trigonometry to compute the target height ‘h’ in terms of these quantities as shown in equations 1-3. Terrain Model) from the DSM (Wang, et. al. (2002)) and this is offered as a Core Product along with the DSM and ORI (see Table 2 below). 2.1 Two Airborne IFSAR Implementations Two examples of IFSAR implementation are shown in Figure 2. These two systems (STAR-3i and TopoSAR) are both deployed operationally by Intermap. A third system, STAR-4, has recently been developed by Intermap and is currently being flight tested. Figure 1. Schematic of Airborne IFSAR Geometry. sin(θf - θb) = δ/B δ/λ = φ/(2∗π) + n h = Η − rs cos (θf) (1) (2) (3) The path-difference ‘δ’ is measured indirectly from the phase difference between the received wavefronts (eqn. 2). Because the phase difference can only be measured between 0 and 2π (modulo 2π), there is an absolute phase ambiguity (‘n’ wavelengths) which is normally resolved with the aid of relatively coarse ground control. A “phase unwrapping” technique (e.g. Goldstein et al, 1988) completes the solution. Thus the extraction of elevation is performed on the “unwrapped” phase. Often the IFSAR is operated in a so-called ping-pong mode which effectively doubles the value of the geometric baseline B. These equations become the basis for sensitivity and error analysis (e.g. Rodriguez and Martin (1996). A direct consequence is the recognition that for the airborne IFSAR system STAR-3i, the dominant error source is ‘phase noise’ so that the signal-to-noise ratio, which is a function of flying height among other factors, becomes a means of (partly) controlling height error specifications. When there is a fixed, rigid baseline separating the two antennas, the signals are collected simultaneously (single-pass interferometry). The same principles apply if the data are received by the same antenna in subsequent passes (repeat-pass interferometry). Significant issues then become (1) for satellites: temporal de-correlation due to change in target between passes (for example Radarsat has a 24 day repeat cycle) and (2) for airborne systems: positional uncertainty. This schematic idealization is replaced of course by many factors in the practical implementation of IFSAR. For example a complex image containing phase and magnitude information is created from the signal received at each antenna. Subsequent operations on the complex images allow three ortho-rectified products to be derived: DEM, Magnitude and Correlation. The DEM, as noted earlier, is usually referred to as a DSM in recognition that the received signal relates to the scattering surface which may be the terrain or could be an object upon the terrain, natural or otherwise. The magnitude is often referred to simply as an ORI (Ortho-Rectified Image). In relatively open urban or forest situations, it is possible to create a DTM (Digital Figure 2. STAR-3i (left) and TopoSAR (right) STAR-3i was originally designed and built by ERIM, but has subsequently had major upgrades in hardware and software (Tennant, et. al., 2003). TopoSAR was originally developed by AeroSensing under the name AeS-1 (Hoffman, et. al., 2001) and has also experienced upgrades – mostly in the processing area. Some of the salient characteristics of the two systems are shown in Table 1. The STAR-3i system has a higher data acquisition capacity while the TopoSAR can achieve finer resolution. Of greater interest however is its multi-polarization P-Band capability. Typical Parameters Platform Altitude (km) Speed (km/hr) Frequency Band Centre Wavelength (cm) Image Resolution (m) Polarization Swath Width (km) IFSAR Mode DEM Spacing (m) STAR-3i Lear Jet 6.5 - 9.5 700 X 3 1.25 HH 5, 10 Single_Pass 5 TopoSAR AeroCommander 3.5 - 6.5 450 X P 3 74 0.5 - 2 2 HH HH,VV,HV/VH 2, 4, 7 4 Single Repeat-Pass 1, 2.5, 5 2.5 Table 1: Typical operating parameters of STAR-3i and TopoSAR airborne IFSAR systems. A consistent set of Core Product DEM and ORI specifications irrespective of platform has been created and is summarised in Table 2. Varying flying altitudes and operating modes, enables different accuracy specifications to be achieved which may be reflected in cost and other factors. Product DSM DTM Type RMSE Spacing RMSE Spacing I 0.5 5 0.5 5 II 1 5 1 5 III 3 10 Table 2: Intermap Core Product specifications for IFSAR DEMs. All units are meters. RMSE refers to vertical accuracy and is with respect to terrain that is moderately sloped, bare (DSM) and unobstructed. Details may be found at www.intermaptechnologies.com. These specifications apply to X-Band products only. 3. NATIONAL MAPPING PROGRAMS: NextMap Because of the acquisition capacity demonstrated by STAR-3i and improvements in the processing chain, it has become feasible to perform national mapping programs at the specifications listed (Table 2) over reasonable periods of time. Intermap’s name for this type of program is Nextmap. The first such program done with a 1 meter or better vertical specification was NextMap Britain. Deliveries of DSM and DTM and ORI for the whole of Nextmap Britain include 2800 tiles (10km x 10km) referenced to the British Ordinance Survey grid. One of the key operational factors in this rapid acquisition was the use of long flight lines – 200km over much of the area. In order to remove systematic errors, orthogonal tie lines were flown every 50 km and were tied down by trihedral corner reflectors that had been surveyed in with DGPS. GPS baselines for the airborne acquisition were maintained within 75 km for the Type II specification and less for the Type I acquisition. Type II acquisition occurred at 28,000’ – 30,000’ flying altitudes, while Type I was flown at 20,000’ – 22,000’ to improve signal-to-noise performance as noted above in section 2. 3.1 NextMap Britain The NextMap Britain program was performed in two phases. Phase I saw the acquisition, processing, delivery, validation, acceptance and release of the data performed over an 18 month period starting in December 2002 for an area that included England, Wales and the southern portion of Scotland (Figure 3). In Phase II, the Northern part of Scotland was acquired with delivery occurring now and release scheduled for July, 2004. The Phase I requirement, was for Type II DSM and DTM delivery over about 150,000kmsq with Type I specification for about 50,000kmsq of the low-lying, flood-prone SE part of England. 3.1.1 Validation: Several forms of validation have been reported on in the course of this program, both external (Dowman, (2004) and Duncan, et. al. (2004)) and internal (Mercer, et. al., 2003). Results are consistent among these studies although they vary somewhat in their approach. Dowman’s approach was to examine a sub-area in great detail, inter-comparing lidar, GPS, photogrammetric and IFSAR results in different terrain and terrain cover situations. Comparing the IFSAR results to these forms of truth, the DSM and DTMs varied from (approximately) 0.5 m to 1.1 m RMSE in various conditions. The approach of Duncan, et. al. was to take advantage of the relatively wide-spread lidar (Optech ALTM 2033) and GPS ground sample coverage that had been acquired by the Environmental Agency. The lidar DTMs themselves, originating with ground samples at 0.25 – 2 meter sampling density, had been validated in the vertical at better than 10 cm RMSE according to some 627 GPS test sites distributed around the country. Of these 322 GPS test sites were used for the IFSAR comparison, each with at least 100 points contributing to the derived RMSE. Similarly, some 595 lidar test sites were used for the IFSAR comparison, with several thousand points per site contributing to the statistics. All test points were collected at least 6 meters from the nearest building or other obstruction, to prevent biasing the statistics. The DTM results reported by Duncan, et. al. (2004) are summarised in Table 3. DTM (IFSAR - GPS) Statistics # Sites <RMSE> Type I 130 0.51 Type II 192 0.75 (IFSAR - LIDAR) # Sites <RMSE> 234 0.64 meters 361 0.92 meters Table 3. Summary of observed site statistics for IFSAR DTM differences with respect to GPS and Lidar (Duncan, et.al., 2004). Note that <RMSE> refers to the mean RMSE taken over all of the test sites. Type I and II refer to the areas (50,000kmsq and 150,000kmsq in size, respectively) where the different acquisition specifications established by Intermap (Table 2) were implemented. See details in text. Figure 3. Part of NextMap Britain, this shaded relief image of the resulting DTM includes England and Wales (from Duncan, et. al., 2004). The data for this example were acquired during about three months of night-time flying followed by one year of processing and editing. It should be noted that further breakdown of the test sites into those in urban and non-urban areas showed the errors in the former to be larger (approximately 30%) than in the non-urban areas. Table 3 comprises both urban and non-urban sites. In the tests performed by the author, (Mercer, et. al. (2003), a smaller (33 lidar tiles, each 2km x 2km ) but well distributed sub-set of the same lidar DSM data provided by the Environmental Agency was examined. The purpose was to check the IFSAR performance according to the definitions established for testing Core products (as described in the previously referenced product handbook) and essentially provides a baseline performance level. The method encompassed DSMs and DTMs. DSM data were segmented, using the ORI, to exclude forests, structures, etc., from the test statistics so that the DSM data would reflect bare earth performance. Somewhat lower mean RMSE values were obtained for the DTMs than in the Duncan study, probably reflecting the fact that no urban data were included. We show a single example of a 2km test site in Figures 4 and 5. Figure 5. The IFSAR DSM and DTM are shown in yellow and red respectively. The lidar DSM is shown in green. It has partially penetrated the wooded area. 3.1.2 Economic Model: The possibility to reduce costs to the end-user are enhanced in these national programs. Because they are ‘seamless’ data sets there is a demand in the first instance by entities who wish to have a single nation-wide consistent data set for their applications. In this instance, the first customer was Norwich Union, a major insurance company whose specific interest is the application of the DSM, DTM and ORI in support of flood modelling which in turn is part of their flood risk analysis activities (Saunders, et al, 2001). By retaining license rights, Intermap has able to resell the data from its data base at a price that is considerably lower than the cost would have been for a single customer/owner. The price impact is illustrated in Figure 6, where unit price (US$/kmsq) is contrasted for different technologies addressing levels of vertical accuracy as noted in section 1 of this paper. For example, a customer now can license a 10,000kmsq DTM in Britain for about US $6/kmsq. DEM Cost vs.Vertical Accuracy Aerial Photography (Urban) $1,000 Unit Price ( US $ / km 2 ) LIDAR $100 $10 $1 March 2004 Figure 4. Counter-clockwise from upper left, IFSAR ORI, IFSAR DSM, (IFSAR – Lidar) DSM difference surface with scale bar, Lidar DSM (Mercer, et. al., 2003). The relative noise difference (sigma ~41 cm) between the two DSMs is clear in the difference surface as is the response to the forests. A profile across one of the wooded areas of Figure 4 is provided in Figure 5. After masking out the non-bare areas, the mean offset between IFSAR and lidar was 21cm in this example, with total RMSE = 50 cm. Elevation Profile Intermap IFSAR Custom Project SPOT Satellite Satellite Stereo SAR 100 Intermap IFSAR NEXTMap (10,000 kmsq) 10 1 Vertical Accuracy (m) RMS 0.1 Increasing Detail Figure 6. Unit cost comparison of DEMs as a function of typical vertical accuracies addressed by various technologies. The impact of the NextMap type of program is shown to reduce cost to the end user by a factor of 3-4 compared to the custom project approach. The example shown here is based upon a requirement for 10,000kmsq (smaller areas would cost more, larger areas less). The range of values encompasses other Nextmap areas and specifications as well as the specifics of license type (see www.intermaptechnologies.com for details). 3.2 The Next ‘NextMap’ Program 15.0 Intermap announced at the ASPRS meeting in Charlston, SC, 2003, that it would be undertaking a NextMap USA program, roughly modelled on the NextMap Britain experience. This is a major challenge given the size of the USA (approximately 9 million kmsq). Since that date it has begun the effort and is scheduling it to occur over a period of 4-5 years. New sensors are being built to facilitate the effort and to be able to continue to address other programs. 12.5 Meters 10.0 7.5 5.0 2.5 0.0 0 50 100 150 200 Meters 250 300 350 400 Also underway is a NextMap program in Indonesia with Type III product specifications (Table 2). 4. THE USE OF P-BAND IFSAR FOR OBTAINING BARE-EARTH DEMS BENEATH FOREST CANOPY The use of long-wavelength IFSAR has been posited for many years as a possible means of obtaining bare-earth DEMs through forest canopy. Long-wavelength in this context usually means L-Band or P-Band. As interest has grown, theoretical advances have perhaps outstripped experimental demonstration however. Among the major research centers working in this area, DLR and various collaborators have demonstrated the use of fully-polarized L-Band repeat-pass IFSAR in forests in Scotland and Germany. The relatively new GeoSAR system has single-pass P-Band capability and results are expected to be published imminently. In this paper we wish to summarize results that were first presented by Mercer, et. al. (2003b). The ‘Capitol Forest’ project, utilized the X-Band and P-Band capabilities of the TopoSAR system (Figure 2 and Table 1). The project area is a 5.2 kmsq forestry research test site in Washington State, USA, was funded by the Makah Tribe, and has been extensively ground-truthed by members of a forestry research consortium which includes the University of Washington and the Forestry Research Center of the USDA (Andersen, et al. 2003). The truth includes: 290 ground survey points, located beneath the canopy, as well as others in cleared areas; lidar data from a helicopter-borne SAAB TopEye system providing 4 points/msq; and aerial color photography at various scales (1:12,000, 1,7000 and selected stereo at 1:3,000). The site has a range of forest conditions and terrain conditions. The forest is mainly Douglas-fir and western hemlock. One of the stands is mature 70-year unthinned growth with a stand density of 280 stems/hectare and tree heights exceeding 40 meters. Other stands are younger and have been thinned to varying degrees. Additionally there are areas of clearcut. A color ortho-photo shows the area along with the locations of the ground survey points (Figure 7). polarimetric response. In this work, the polarization bases were optimized according to an internally developed coherence optimization scheme and the assumption was made that the optimum coherence corresponds to the polarization state associated with the ground return. This makes the results somewhat model independent (apart from the stated assumption). The delivered results included an X-Band DSM and a P-Band DSM and DTM as well as various strip products and ancillary information. The data were processed and delivered to the client without the benefit of the fore-mentioned ground control (apart from four control points in cleared areas). However it was possible to perform a sanity check of the products by comparing X and P-Band profiles in transition areas from bare to forest (Figure 8). This profile shows the X-Band following the forest canopy (it actually underestimates the tree tops by several meters (Andersen, et. al. (2003)), and beneath it the PBand DSM and DTM. In this instance the DTM only differs from the DSM in that it has been smoothed. It appears that the P-Band is sampling ground as it makes the transition from bare to forest and back. In Table 4 we present the results upon comparing the P-Band DTM with the ground survey points. The slopes were moderate at the locations of these points. Profile A 360 350 340 330 320 310 300 Figure 7. Ortho-photo of test area. Coloured points show the location of the ground survey points. Color-coding differentiates degrees of thinning in the various stands (e.g. white indicates no thinning, and yellow is lightly thinned. The terrain has very challenging slopes, from flat up to 45 degrees. The area was flown in September 2002 by TopoSAR. The coverage included two opposite looks of X-Band data and four orthogonal looks of P-Band acquisition. Two IFSAR baselines were acquired for comparative purposes (50 meters and 83 meters). The 83 meter results were superior and are presented here. Importantly, P-Band data were acquired in fully polarimetric mode (HH, VV, HV and VH). The relevance of this remark is that while long-wavelength signals do penetrate to the ground, the interferometric response is from the whole of the canopy; the idea is that the response from different parts of canopy/ground system can be differentiated by their 290 0 100 200 300 400 Meters 500 600 700 800 Figure 8. Top: Air photo with location of profile overlaid. Bottom: Elevation profile showing X-Band DSM (dark green), P-Band DSM (red) and P-Band DTM (light green). (X-P) differences as much as 40 meters may be observed. (P-GCPs) Mean Std Dev'n RMSE n Degree of Forest Thinning Clear Cut Heavy Light Un-Cut -0.5 -0.4 -0.2 0.4 meters 1.2 1 2.3 3.3 meters 1.3 1.1 2.3 3.3 meters 38 21 148 121 Table 4. Statistics of (P-Band DTM – ground survey points) for varying degrees of forest density. In the mature growth uncut area surveyed, average canopy height was about 45 meters and tree density about 280 stems/hectare. Two points should be noted: (1) there appears to be little mean offset irrespective of the tree density which implies that the at the sub-meter level, the ground is being detected, and (2) the RMSE grows with increasing tree density from about 1.3 meters to 3.3 meters. Similar lidar comparisons with truth indicated a bare lidar RMSE of 0.5 meters in the uncut stand. This enables us to use the lidar results with some confidence over the remainder of the area. In Figure 9 we summarize the (P-Band – Lidar) differences for various tree height classes and for three slope classes. We note that the tree height estimates are based upon (X - P) height differences, which will therefore underestimate the true heights as noted earlier. Moreover, they are likely to underestimate the true heights increasingly as tree density is reduced. This is not accounted for in this figure. The major points to be observed are: (1) (P-Band DTM – Lidar) RMSE increases with tree height (from 1.6 to about 3.2 meters for moderate slopes) with the larger error corresponding to tree heights (after correction) greater than 45 meters. (2) (P-Band DTM – Lidar) RMSE increases with slope for all tree height classes ( by 30% - 50% for the largest slopes. (3) These results are consistent with the ground survey results (4) Although not shown here, there is no consistent mean offset that is dependent upon tree height. However there appears to be a persistent increase of mean offset with increasing slope. The second event, is the demonstration of bare-earth DEMs beneath significant closed forest canopy derived from fullypolarized P-Band IFSAR. Together with X-Band as a proxy for tree height, this appears to offer the possibility of creating biomass maps and forest fuel mapping implementation (see Andersen, et. al. (2004)). To date there have not been many examples of long wavelength (L-Band or P-Band) IFSAR bareearth DEMs beneath canopy with well- ground-truthed ancillary information. However it is expected that there will be more in the near future from both commercial and research organizations. There are a number of research issues and operational implantations to be addressed that were not discussed in this paper. Indeed the status is a long way from that demonstrated with X-Band IFSAR in non-forested regions. However the potential appears to warrant increased activity in this area with consequent rewards for the effort. ACKNOWLEDGEMENTS P-Band RMSE vs. Tree Height The author would like to acknowledge his colleagues at Intermap both in Engineering and Operations whose contributions were decisive for the success of the two projects described in this paper. 7.00 (P-Band – Lidar) RMSE (m) create DEMs with meter to sub-meter accuracy, posted at 5 meter intervals. The validation exercises described, one of which is perhaps the most extensive to be conducted by the mapping industry, would suggest that the ability of airborne IFSAR to contribute to a mainstream mapping activity has been well and satisfactorily demonstrated. Moreover, the economic model described is such that it makes DEM data of mapping quality, available to organizations and individuals at prices that should promote its use to a greater extent than previously seen. This in turn should further the growth of applications based upon three-dimensional input. While we have in this paper emphasized IFSAR-derived DEMs it is our belief that they are complementary to the other technologies both space-borne and airborne. The expectation is that we will see increased merging of airborne IFSAR with other data sources in order to optimize the solutions that users require. 6.00 5.00 4.00 Slope < 10° 10° < Slope < 20° Slope > 20° 3.00 2.00 1.00 0.00 0-5 5-15 15-25 Tree Height (m) 25-35 35+ Figure 9. (P-Band DTM - Bare Lidar) RMSE as a function of tree height and for three slope categories (<10 degrees, (10 – 20) degrees, and >20degrees). Tree height classes are underestimated (see text) and show intervals (0-5), (5-15), (1525), (25-35) and >35 meters. 5. DISCUSSION AND CONCLUSIONS This presentation has focussed on what the author believes are two of the more important ‘events’ that have occurred in the past few years, at least as seen from the perspective of commercial airborne IFSAR and its growth and contribution to mapping. The first event was the demonstration of a mapping program on a national scale - NextMap Britain - with the capability to REFERENCES Andersen, H-E, R. McGaughey, S. Reutebuch, and B. Mercer. 2004. Estimation of forest inventory parameters using interferometric radar. First International Digital Forestry Workshop, Beijing, China, June 14-18, 2004. (to appear) Andersen H-E, RJ McGaughey, W. Carson, S. E. Reutebuch, B. Mercer, J. Allan, 2003. A Comparison of Forest Canopy Models Derived from Lidar and InSAR Data in a Pacific Northwest Conifer Forest. Proceedings of the ISPRS WG III/3 Workshop on 3-D reconstruction from airborne laserscanner and InSAR data, Dresden, Germany Cloude, S.R., K.P. Papathanassiou, 1998. Polarimetric SAR Interferometr, IEEE Transactions, Vol. GRS36. No. 5, pp. 1551-1565 Duncan, A., B. Kerridge, J. Michael, A. Strachan, 2004. The National Flood Mapping Program: Using IFSAR for Flood Modeling in England and Wales. Proceedings of ASFPM 2004 Annual Floodplain Management Conference, Biloxi, Miss, USA Gray, Laurence A., and P.J. Farris-Manning, (1993). RepeatPass Interferometry with Airborne Synthetic Aperture Radar. IEEE Transactions on Geoscience and Remote Sensing. Vol. 31: Number 1, pp 180-191. Goldstein, R.M., H.A. Zebker, and C. Werner, (1988). Satellite Radar Interferometry: two dimensional phase unwrapping. Radio Sci. Vol. 23: Number 4, pp 713-720. Hofmann, C., M. Schwabisch, S. Och, C. Wimmer, and J. Moreira, 1999. Multipath P-band interferometry – first results. In: Proceedings of the Fourth International Airborne Remote Sensing Conference and Exhibition/ 21st Canadian Symposium on Remote Sensing, Ottawa, Ontario, Canada. Madsen, Soren N., H.A. Zebker, and Jan Martin, (1991). Topographic Mapping Using Radar Interferometry: Processing Techniques. Pre-print submitted to IEEE Geoscience and Remote Sensing December 6, 1991. Mercer B, (2003a). Three dimensional Mapping from InSAR and LIDAR, Proceedings of ISPRS Joint Workshop of ISPRS WG I/3 and II/2, Portland Oregon, USA 17th – 19th June 2003. (CDROM Presentation). Mercer, B., J. Allen, N. Glass, S. Reutebuch, W. Carson, and H.-E. Andersen, 2003. Extraction of Ground DEMs Beneath Forest Canopy Using Fully Polarimetric InSAR. In: Proceedings of the ISPRS WG I/3 and WG II/2 Joint Workshop on three-dimensional mapping from InSAR and LIDAR. Portland, OR, USA. (CD ROM Presentation) Mura, J., L. Bins, F. Gama, C. Freitas, J. Santos, and L. Dutra, 2001. Identification of the tropical forest in Brazilian Amazon based on the DEM difference from P- and X-band interferometric data. In: Proceedings of the Geoscience and Remote Sensing Symposium 2001, IGARSS ’01, Sydney, Australia. IEEE, vol. 2. pp. 789-791. Schwabisch, M. and J. Moreira, 1999. The high resolution airborne interferometric SAR AeS-1. In: Proceedings of the Fourth International Airborne Remote Sensing Conference and Exhibition/ 21st Canadian Symposium on Remote Sensing, Ottawa, Ontario, Canada. Tennant, J.K, T. Coyne, and E. DeCol, 2003. STAR-3i Interferometric SAR (InSAR): More Lessons Learned on the Road to Commercialization.Proceedings of the ASPRS Conference, Charleston, SC, USA, CD ROM Treuhaft, R.N., P. Siqueria, 2000. Vertical Structure of Vegetated Land Surfaces from Interferometric and Polarimetric Radar, Radio Science, Vol. 35(1), pp 141-177 Wang, Y., B. Mercer, V.Tao, J. Sharma, and S. Crawford, 2001. Automatic Generation of Bald Earth Elevation Models from Digital Surface Models Created Using Airborne IFSAR. Proceedings of ASPRS 2001, Washington, DC, CD ROM Zebker, Howard A., and J. Villasenor (1992). Decorrelation in Interferometric Radar Echoes. IEEE Transactions on Geoscience and Remote Sensing, Vol. 30: Number 5, pp 950959.
