INVESTIGATION OF LINEAMENTS FROM REMOTE ... * . **
advertisement
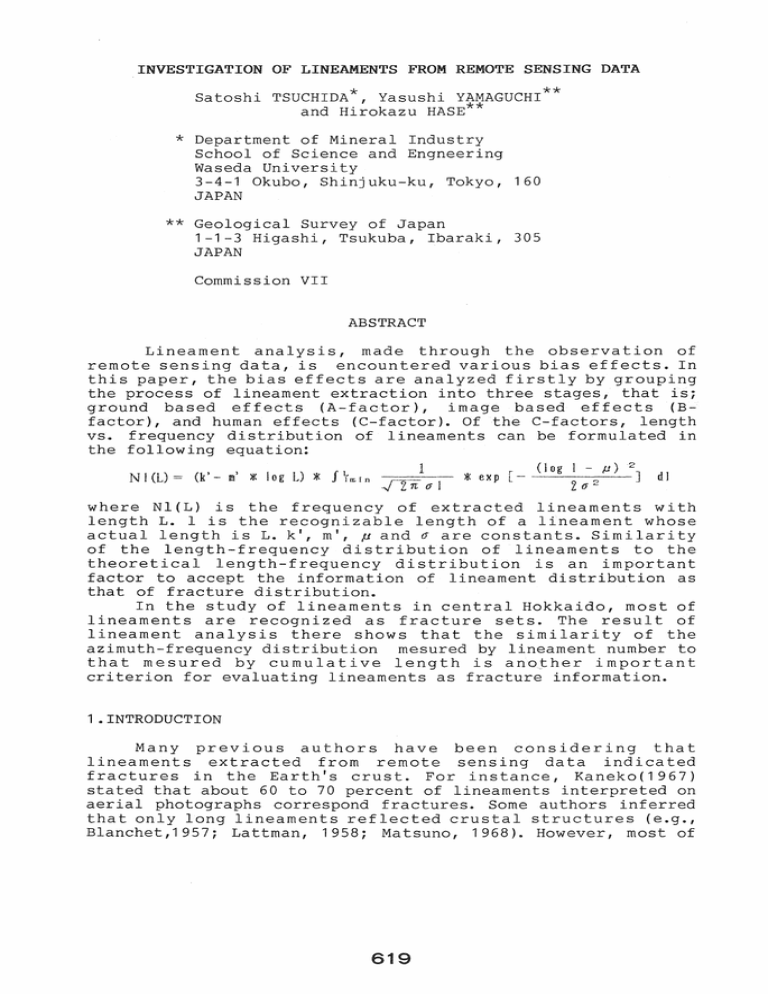
INVESTIGATION OF LINEAMENTS FROM REMOTE SENSING DATA Satoshi TSUCHIDA * , Yasushl. YAMAGUCHI ** and Hirokazu HASE** * Department of Mineral Industry School of Science and Engneering Waseda University 3-4-1 Okubo, Shinjuku-ku, Tokyo, 160 JAPAN ** Geological Survey of Japan 1-1-3 Higashi, Tsukuba, Ibaraki, 305 JAPAN Commission VII ABSTRACT Lineament analysis, made through the observation of remote sensing data, is encountered various bias effects. In this paper, the bias effects are analyzed firstly by grouping the process of lineament extraction into three stages, that is; ground based effects (A-factor), image based effects (Bfactor), and human effects (C-factor). Of the C-factors, length vs. frequency distribution of lineaments can be formulated in the following equation: (log I - P )2 1 N 1(L) = (k' - m' J dl 20- 2 where Nl(L) is the frequency of extracted lineaments with length L. 1 is the recognizable length of a lineament whose actual length is L. k', m', f1. and (J are constants. Similarity of the length-frequency distribution of lineaments to the theoretical length-frequency distribution is an important factor to accept the information of lineament distribution as that of fracture distribution. In the study of lineaments in central Hokkaido, most of lineaments are recognized as fracture sets. The result of lineament analysis there shows that the similarity of the azimuth-frequency distribution mesured by lineament number to that mesured by cumulative length is another important criterion for evaluating lineaments as fracture information. )j( log L) >I< >I< exp [ - 1.INTRODUCTION Many previous authors have been considering that lineaments extracted from remote sensing data indica ted fractures in the Earth's crust. For instance, Kaneko(1967) stated that about 60 to 70 percent of lineaments interpreted on aerial photographs correspond fractures. Some authors inferred that only long lineaments reflected crustal structures (e.g., Blanchet,1957; Lattman, 1958; Matsuno, 1968). However, most of 1 these discussions were derived empirically without enough field evidence nor theoretical examinations. A fracture measurement along a survey line crossing a lineament is an useful method to verify a lineament as a fracture set. For instance, Yamaguchi (1984) showed that the zones with high fracture densities corresponded well to the possible locations of lineaments. Fig.1 shows another example in the Oyubari area of Japan that the location with the highest fracture density indicates a lineament, which was extracted on aerial photographs and is approximately 1,000 meters long. This fact suggests that even a short lineament not longer than 1,000 meters reflects a fracture set. If a direct measurement of fractures is not applicable due to such reasons as poor outcrops, a soil gas survey might be a substitutional method for investigating a lineament (Yamaguchi et al., 1984). Consequently, these field evidences strongly suggest that most of lineaments interpreted by geologists on remote sensing images indicate fractures. However, as it is impossible to check all the lineaments extracted from images, it often raises a doubt to use lineaments for a statistical evaluation of fractures in regional scale. The fundamental difficulty in discussing lineaments reflects the complex processes of lineament interpretation and the associated bias effects. This paper employs a statistical approach and discusses the possibility whether lineaments can be used as a tool for a evaluation of fractures in regional scale. Particularly, the bias effects in the processes of lineament extraction from remote sensing data is investigated using the length-frequency and azimuth-frequency distribution of lineaments .. 2.LENGTH-FREQUENCY DISTRIBUTION Recognition of fractures via remote sensing data observation is governed by many acquired experiences and intelligence of geologists. Let us assume an area of interest for fracture information extraction first hand. There develop fractures and the characteristics of surface traces of them as topographic features obey several geologic rules. We call these ruling factors to be A-factor in this paper. Some of fracture traces are imaged by a remote sensor and some others are not due to images control factors such as resolution. These factors inherent with image data are called B-factor. In the course of extracting presumable fracture information as lineament information from the image data of the area concerned, we encounter eye-sensor factors as well as complex perceptive process in our eye-brain system. We call this factor to be Cfactor here. The recognition processes of fracture information described above is grouped and given as a flow chart(Fig. 2). Of the C-factor, C-1 factor seems most dominantly affect lineament extraction from image data. The magnitude-frequency relationships of the fractures (first group in Fig. 2) have been studied by many previous authors, e.g., the displacement-frequency distribution of minor 620 faul ts (Kakimi, 1 980) and the width-frequency distribution of micro-cracks (Watanabe, 1979). In general, length of a fracture is very diff icul t to know by ei ther field geologic mapping or laboratory measurements. On the contrary, length is the only available measure to show the magnitude of a lineament on image data. Therefore, we will employ the length-frequency distribution to describe characteristics of the lineament groups and to study these effects. It is reported that the field measurement on magnitude vs. frequency of fractures shows a systematic relation given by the following experimental equation: log N(M) = k - m * log M (1 ) where N(M) is the frequency of fractures whose magnitude is M. m is the constant showing the decreasing rate of the frequency of fractures. k is a constant depending upon measurement conditions such as accuracy and total fracture number. When Yamaguchi and Hase (1983) tried lineament extraction using various scale of images, they obtained a result that extracted lineaments from an images with a definite resolution and scale showed parabolic distribution with a maximum when plotted on a logarithmic graph with X axis to be lineament length and Y axis to be number of lineaments. And when all the result of lineament extraction from various scale of image was superimposed onto a logarithmic graph, the distribution of lineaments showed in great extent to follow a similar relation expressed as the following equation. log N(L) = k' - m' * (1 log L I ) where N(L) is the frequency of lineaments with length L. k' and m' are con$tants. However, they reported that apparent departure from the equation had been found in case of short lineaments. They considered that the departure from the equation especially obtained for lineaments of short lengths would be due to the resolution-scale probl~m related to human eyes. This paper discusses on this problem as the C-1 factor introducing a probability function on analysis. Suppose a lineament with the total trace length L and its information as a topographic characteristics on an image for the extraction is given by segments I i (Ell ~L). Two segments constitute end point of L. The probability to distinguish L from collecti ve informa tion 11, 12, is con trolled by independent probability p1; kern-col and kern-bat, p2i fault scarp, p3i debris slide, to distinguish b , ~, Therefore, P(l), probability to distinguish L, is expressed as: P(l) = p1 * p2 * p3 * (2 ) Logarithmic expression of (2) is; log P (1) = log p1 + log p2 + log p3 + .... e. 621 (3 ) In our eye-brain perceptive process, the probability P(l) to distinguish collective segments of l(El;) to be L becomes high as 1 increases from lmin until it comes to knee point and after that the rate of increase becomes gradual. P(l) eventually approaches to show logarithmically-normal distribution (Takayasu, 1986) as known as the central limit theorem. It is given by the following equation: P (1 ) 1 = where p and as: P(L) = _.J--I1i7·~I-~ (log /.1) * ex p [-_. ----·--2-~-2---] J -- 2 (4 ) are constants. The probability P(L) is expressed f ~mln P(l) dl (5 ) Theoretical distribution of lineaments introducing the probability equation is shown in Fig .. 3 .. Also as described in the following chapter, the result of lineament extraction made for the studied area in Oyubari is plotted in Fig. 4. This shows that the result of Yamaguchi and Hase (1983) may be explained by the probabilistic process discussed above. 3.AZIMUTH-FREQUENCY DISTRIBUTION A study on the relation between fractures and lineaments was made by one of the authors(Tsuchida) in conjunction with detailed field survey in the Oyubari area of central Hokkaido, Japan. The azimuthal distribution of lineaments extracted from aerial photographs on the study area I to VI (Fig. 5) was shown as the rose diagrams and frequency vs. length distribution diagrams in Fig .. 6. Rose diagrams in Fig. 6(a) show the azimuth-frequency distribution mesured by lineament number, and (b) shows the azimuth-frequency distribution mesured by cumulative lengths of lineaments from area I to VI. The symbol S in the Fig. 5 indicates the locations where field fracture measurements were made .. In the I and II areas, the length-frequency distribution is less similar to the theoretical distribution. Comparing Fig. 6 (a) and (b), we find that better similarity is found in the areas IV, V, and VI rather than the areas I, II, and III. A difference is also noticed between the two types (Fig. 6(a) and (b)) of rose diagrams. These facts suggest us the following. When we limitedly do statistic analysis, either the azimuth-frequency distribution of lineament numbers or that of cumulative lengths, the difference of counting a long single lineament or concentration of many short lineaments with the same orientation can not be treated properly .. It can be said that when we have detailed fracture data by a field survey on a limited area and want to apply lineament information to fracture information over a wider area including the survey area, statistic examination on the result of lineament extraction described in this paper seems useful .. In this case, we need to know in the first that the objective area has sufficient and/or proper extent for the purpose. In the second, it is useful to see whether the lengthfrequency distribution of lineaments examined in the area follows the equation as described in the former chapter. In the third step, it is meaningful to see the similarity of the azimuth-frequency distribution of lineament number and that of frequency distribution of cumulative lengths of lineaments. If these two show similar mode statistically, the lineament information increases the value as fracture information. 4.CONCLUSION This study has lead the following conclusions. i) The process of extracting lineaments is controlled by various factors as shown in Fig. 2. ii) The C-1 factor, the longer the segments of a lineament, the higher the probability to be extracted by visual interpretation of remote sensing images, and it gives the greatest effect on the length-frequency distribution of extracted lineaments. The distribution can be explained by the following eqution: 1 - (log I - fJ) 2 N I (L) = (k' - m' Jog L) irIDin 1exp [J dl * * 1 .... 2nO"I * '? 20"<'- where Nl(L) is the frequency of extracted lineaments with length L. 1 is the recognizable length of a lineament whose actual length is L. kl, m', p and u are constants depending upon measurement conditions. iii) Similarity of the length-frequency distribution of lineaments to the theoretical length-frequency distribution is an important factor to accept the information of lineament distribution as that of fracture distribution. iv) Similarity of the azimuth-frequency distribution of lineament number to that of cumulative length is another important criterion for evaluating lineaments as fracture information. v) Statistical analysis of lineaments in the Oyubari area shows that most of the lineaments extracted from remote sensing data can be considered as fracture sets. 623 REFERENCES Ba tes, R. L .. and Jakson I J .. A., 1 984: Dictionary of geological terms-3rd ed .. Amer. Geol. Inst", 296pp .. Blanchet, P. H. , 1957: Development of fracture analysis as exploration method. Bull. Amer .. Assoc. Petrol .. Geol. , 41, 8, 1748-1759. Kakimi, T., 1980: Magnitude-frequency relation for displacement of minor faults and its significance in crustal deformation. Bull. Geol. Surv .. Japan, 31, 10, 467-487 .. Kaneko, S., 1967: Structural geography. Kokin-shoin, Tokyo, 192pp. Lattman, L. H., 1958: Technique of mapping geologic fracture traces and lineaments on aerial photographs. Photogram. Eng., 24, 568-576 .. Matsuno, K., 1968: Interpretation of geologic structures on aerial photographs. How to treat linear visible on aerial photographs. Chinetsu, 17, 14-21. Takayasu, H., 1986: Fractal. Asakura, Tokyo, 186pp. Yamaguchi, Y. and Hase, H., 1983: Frequency analysis of lineaments using various kinds of images-an applied case of radar imagery to the Yakushima Island, Japan-. Jour. Japan Soc. Photogram. Remote Sensing, 22, 3, 4-13. Yamaguchi, Y., 1984: Geothermal exploration using remote sensing data. Chinetsu Enerugi, 9, 4, 771-784. Yamaguchi, Y., Hase, H.. , Yano, Y. and Kinugasa, Yo, 1984: Lineament analysis on radar images in the Hohi Geothermal Area and the geological implication of Toyooka-Miyanoharu line by a soil gas survey. Jour. Geothermal Research Soc. Japan, 6, 2, 1 01 -1 20. Watanabe, Ke, 1979: Micro-crack system in granitic rock and its quantitative evaluation. Jour. Japan Soc. Engineering Geol., 20, 2, 59-68 .. 624 N - - - - All ...... ~ ..............- ! 30 - - - - - -! 15 ----:!: 5 -6 E 30 15 5 " l... <1» ..0 '" lIneament 55 z >t(j)4 m I\) en • :Q: •• ~ ••• z ,/ w 0 ;',a.... ...... :' I ..... ~ ...... 3 : :' : I 2 ··U· ". i"... ........ . /..... ./..... . '. ,: . /:', \,. . . . .....• . ..., \. .. . / \.. • . /~:'" 1 .' . \ loo..... '\'. .., ~ '. •• / '. :/ \ ... I' / L_ - - --~-""'=60 ':/____ -40 -..........;;;. ............ -20 .... , ,'~ / ~ \.. !', ~!.. \\ / \ a I \ . ./ --.. - L__ --(f-~~~·-----20----- j I " I I .. / . / \ L"\.._____ .• ;:, /- ~/ ' ~ •. . ;r • /A'\ :" ". \'. \ / \'" / I I :'. ....: I ...' '" '... V .... \ I ~\.//~~~~ \.~'~'~/.,/ tI.... .. . . . . / ........ _. : ,,\ \ I .:: . ..... \ .. \" I I • o , ...... .., • I I ,/~ _~ ~ 40 (M) Figure 1 Fracture density along a survey line crossing a lineament in the northern part of the Oyubari area. "0 (m)" indicates the location of the lineament. Each line corrsponds lineaments within the azimuth shown in the rose diagram above left .. I J Fractures (First Group) t---------"'i, B-4 I ~--------------~--------------~ ~ ...----------- A-1 The larger the magnitude of a fracture set, the higher the possiblity of its showing as a linear topographic feature. ~ ...------------ A-2 The length of a lineament should always be shorter than that of the corresponding fracture. OIl A-3 A fracture set appears as segments of linear topographic features. A-4 A group of fracture sets such as "en echelon" can appear as a single 't' lineament. Lineaments as Linear Topographic Features (Second Group) B-1 Too short lineament compared with image resolution does not appear on an image. B-2 A group of lineaments on the ground can appear as a single continuous lineament on an image due to the resolution of the image. B-3 Some lineaments with subtle topographic features on the ground do not appear on an image. Lineaments on Images (Third Group) ~B-4 Some fractures do not appear as topographic featurei but appear as tonal linear features 1 on an image. J ' - -_ _ _ _ _ _ _ _ _ _.,.--_ _ _ _ _ _ _ _-.-J C-1 The longer a lineament on an image, the higher the probability of its extraction by naked eyes. C-2 A group of lineaments on an image can be extracted as a single continuous lineament. C-3 Lineaments with relatively large magnitude is not extracted because of the smaller coverage by the image. C-4 Too short lineament can not be extracted by naked eyes. I Extracted Lineament (Fourth Group) Figure 2 The extraction process of "Lineament Group" from "Fracture Group" on the field. *1 This feature may not be called a lineament according to definition by Bates and Jakson (1984). 626 the • LENGTHlx) & NUMBERly} • 1000 fILE TOTAL '" La NAME :fl._lb NUMBER: s6 1047 M 100 .... ..... 10 .01 10 IkM} Figure 3 Theoreticallength-frequency distribution of lineaments. m r N ~ • I,1;N0111(", .. NUMIlt;tt(YI • 1000 FlI,I! N/lMI! :ut.I-Or..ldl TOTII1, NUMn~n: -IU27 Jl L- o 50 M .... o 0 100 OOft -- Skm 0" • ...:. : (0 , . 01 --I .\ I I 10 (~"'I Figure 4 Length-frequency distribution of lineaments in the northern part of the Oyubari area. Figure 5 A radar image of the Oyubari area showing the study areas for lineament analysis. N::54S IV m , ' " .'.... v N:: 1341 ": ."" .\ . , .. ", ..... VI N::1884 . ... , .\ (0) (b) . (c ) (d ) Figure 6 Azimuth-frequency distribution (a, b, c) and length-frequency distribution (d) of lineaments in the northern part of the Oyubari area. (a) lineament number (b) cumulative length (c) average length 628
