Document 11827189
advertisement
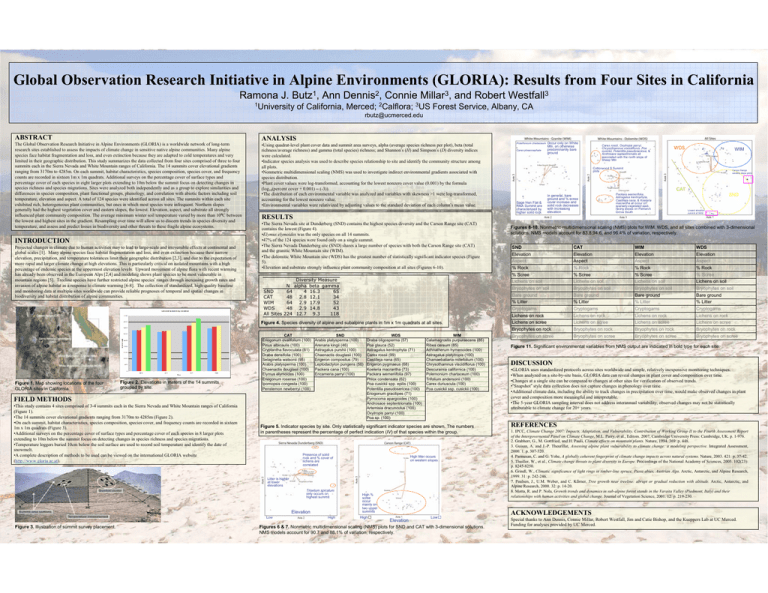
Global Observation Research Initiative in Alpine Environments (GLORIA): Results from Four Sites in California Ramona J. Butz1, Ann Dennis2, Connie Millar3, and Robert Westfall3 1University of California, Merced; 2Calflora; 3US Forest Service, Albany, CA rbutz@ucmerced.edu ABSTRACT ANALYSIS The Global Observation Research Initiative in Alpine Environments (GLORIA) is a worldwide network of long-term research sites established to assess the impacts of climate change in sensitive native alpine communities. Many alpine species face habitat fragmentation and loss, and even extinction because they are adapted to cold temperatures and very limited in their geographic distribution. This study summarizes the data collected from four sites comprised of three to four summits each in the Sierra Nevada and White Mountain ranges of California. The 14 summits cover elevational gradients ranging from 3170m to 4285m. On each summit, habitat characteristics, species composition, species cover, and frequency counts are recorded in sixteen 1m x 1m quadrats. Additional surveys on the percentage cover of surface types and percentage cover of each species in eight larger plots extending to 10m below the summit focus on detecting changes in species richness and species migrations. Sites were analyzed both independently and as a group to explore similarities and differences in species composition, plant functional groups, phenology, and correlation with abiotic factors including soil temperature, elevation and aspect. A total of 124 species were identified across all sites. The summits within each site exhibited rich, heterogeneous plant communities, but ones in which most species were infrequent. Northern slopes generally had the highest vegetation cover and eastern slopes, the lowest. Elevation, aspect, and substrate all strongly influenced plant community composition. The average minimum winter soil temperature varied by more than 10ºC between the lowest and highest sites in the gradient. Resampling over time will allow us to discern trends in species diversity and temperature, and assess and predict losses in biodiversity and other threats to these fragile alpine ecosystems. •Using quadrat-level plant cover data and summit area surveys, alpha (average species richness per plot), beta (total richness/average richness) and gamma (total species) richness; and Shannon’s (H) and Simpson’s (D) diversity indices were calculated. •Indicator species analysis was used to describe species relationship to site and identify the community structure among all plots. •Nonmetric multidimensional scaling (NMS) was used to investigate indirect environmental gradients associated with species distribution. •Plant cover values were log-transformed, accounting for the lowest nonzero cover value (0.001) by the formula (log10(percent cover + 0.001) – (-3)). •The distribution of each environmental variable was analyzed and variables with skewness >1 were log-transformed, accounting for the lowest nonzero value. •Environmental variables were relativized by adjusting values to the standard deviation of each column’s mean value. INTRODUCTION Projected changes in climate due to human activities may to lead to large-scale and irreversible effects at continental and global scales [1]. Many alpine species face habitat fragmentation and loss, and even extinction because their narrow elevation, precipitation, and temperature tolerances limit their geographic distribution [2,3], and due to the expectation of more rapid and larger climate change at high elevations. This is particularly critical on isolated mountains with a high percentage of endemic species at the uppermost elevation levels. Upward movement of alpine flora with recent warming has already been observed in the European Alps [2,4] and modeling shows plant species to be most vulnerable in mountain regions [5]. Treeline species have further restricted alpine species’ ranges through increasing growth rates and invasion of alpine habitat as a response to climate warming [6-8]. The collection of standardized, high-quality baseline and monitoring data at multiple sites worldwide can provide reliable prognoses of temporal and spatial changes in biodiversity and habitat distribution of alpine communities. Figure 2. Elevations in meters of the 14 summits grouped by site. •The Sierra Nevada site at Dunderberg (SND) contains the highest species diversity and the Carson Range site (CAT) contains the lowest (Figure 4). •Elymus elymoides was the only species on all 14 summits. •47% of the 124 species were found only on a single summit. •The Sierra Nevada Dunderberg site (SND) shares a large number of species with both the Carson Range site (CAT) and the granitic White Mountain site (WIM). •The dolomitic White Mountain site (WDS) has the greatest number of statistically significant indicator species (Figure 5). •Elevation and substrate strongly influence plant community composition at all sites (Figures 6-10). N SND 64 CAT 48 WIM 64 WDS 48 All Sites 224 Diversity Measure alpha beta gamma 4 16.3 65 2.8 12.1 34 2.9 17.9 52 2.9 14.8 43 12.7 9.3 118 CAT Eriogonum ovalifolium (100) Pinus albicaulis (100) Cryptantha flavoculata (81) Draba densifolia (100) Selaginella watsonii (95) Arabis platysperma (100) Chaenactis douglasii (100) Elymus elymoides (100) Eriogonum rosense (100) Ipomopsis congesta (100) Penstemon newberryi (100) SND Arabis platysperma (100) Arenaria kingii (46) Astragalus purshii (100) Chaenactis douglasii (100) Erigeron compositus (79) Leptodactylon pungens (50) Packera cana (100) Ericameria parryi (100) FIELD METHODS •This study contains 4 sites comprised of 3-4 summits each in the Sierra Nevada and White Mountain ranges of California (Figure 1). •The 14 summits cover elevational gradients ranging from 3170m to 4285m (Figure 2). •On each summit, habitat characteristics, species composition, species cover, and frequency counts are recorded in sixteen 1m x 1m quadrats (Figure 3). •Additional surveys on the percentage cover of surface types and percentage cover of each species in 8 larger plots extending to 10m below the summit focus on detecting changes in species richness and species migrations. •Temperature loggers buried 10cm below the soil surface are used to record soil temperature and identify the date of snowmelt. •A complete description of methods to be used can be viewed on the international GLORIA website (http://www.gloria.ac.at). WDS Draba oligosperma (57) Poa glauca (52) Astragalus kentrophyta (71) Carex rossii (99) Castilleja nana (65) Erigeron pygmaeus (68) Koeleria macrantha (73) Packera werneriifolia (97) Phlox condensata (62) Poa cusickii spp. epilis (100) Potentilla pseudosericea (100) Eriogonum gracilipes (71) Pyrrocoma apargioides (100) Androsace septentrionalis (100) Artemisia dracunculus (100) Oxytropis parryi (100) Poa sp. (100) WIM Calamagrostis purpurascens (85) Ribes cereum (85) Achnatherum hymenoides (100) Astragalus platytropis (100) Chamaebatiaria millefolium (100) Chrysothamnus viscidiflorus (100) Descurainia californica (100) Polemonium chartaceum (100) Trifolium andersonii (100) Carex duriuscula (100) Poa cusickii ssp. cusickii (100) Figure 5. Indicator species by site. Only statistically significant indicator species are shown. The numbers in parentheses represent the percentage of perfect indication (IV) of that species within the group. Presence of solid rock and % cover of lichens are correlated High litter occurs on western slopes Litter is higher at lower elevations Trisetum spicatum only occurs on highest summit Elevation Low Figure 3. Illustration of summit survey placement. Carex phaeocephala Occur only on White Mtn. on otherwise predominantly bare ground Carex rossii, Oxytropis parryi, Chrysothamnus viscidiflorus, Poa cusickii, Potentilla pseudosericea, & Androsace septentrionalis all associated with the north slope of Sheep Mtn WDS High High % scree occur mainly on two upper summits High Elevation Low Figures 6 & 7. Nonmetric multidimensional scaling (NMS) plots for SND and CAT with 3-dimensional solutions. NMS models account for 90.7 and 88.1% of variation, respectively. WIM Cottonwood S Summit plots Carson Range western slope plots CAT Sage Hen Flat & RNA Summit are characterized by higher solid rock In general, bare ground and % scree cover increase and solid rock decreases with increasing elevation Packera wernerifolia, Astragalus kentrophyta, Castilleja nana, & Koeleria macrantha all occur on sparsely-vegetated eastfacing slopes on Patriarch Grove South RESULTS Figure 4. Species diversity of alpine and subalpine plants in 1m x 1m quadrats at all sites. Figure 1. Map showing locations of the four GLORIA sites in California. Polemonium chartaceum SND Lowest elevation summit at WIM Figures 8-10. Nonmetric multidimensional scaling (NMS) plots for WIM, WDS, and all sites combined with 3-dimensional solutions. NMS models account for 83.8,94.6, and 96.4% of variation, respectively. SND Elevation Aspect % Rock % Scree Lichens on soil Bryophytes on soil Bare ground % Litter Cryptogams Lichens on rock Lichens on scree Bryophytes on rock Bryophytes on scree CAT Elevation Aspect % Rock % Scree Lichens on soil Bryophytes on soil Bare ground % Litter Cryptogams Lichens on rock Lichens on scree Bryophytes on rock Bryophytes on scree WIM Elevation Aspect % Rock % Scree Lichens on soil Bryophytes on soil Bare ground % Litter Cryptogams Lichens on rock Lichens on scree Bryophytes on rock Bryophytes on scree WDS Elevation Aspect % Rock % Scree Lichens on soil Bryophytes on soil Bare ground % Litter Cryptogams Lichens on rock Lichens on scree Bryophytes on rock Bryophytes on scree Figure 11. Significant environmental variables from NMS output are indicated in bold type for each site. DISCUSSION •GLORIA uses standardized protocols across sites worldwide and simple, relatively inexpensive monitoring techniques. •When analyzed on a site-by-site basis, GLORIA data can reveal changes in plant cover and composition over time. •Changes at a single site can be compared to changes at other sites for verification of observed trends. •“Snapshot” style data collection does not capture changes in phenology over time. •Additional climate data, including the ability to track changes in precipitation over time, would make observed changes in plant cover and composition more meaningful and interpretable. •The 5-year GLORIA sampling interval does not address interannual variability; observed changes may not be statistically attributable to climate change for 20+ years. REFERENCES 1. IPCC, Climate Change 2007: Impacts, Adaptation, and Vulnerability. Contribution of Working Group II to the Fourth Assessment Report of the Intergovernental Panel on Climate Change, M.L. Parry, et al., Editors. 2007, Cambridge University Press: Cambridge, UK. p. 1-976. 2. Grabherr, G., M. Gottfried, and H. Pauli, Climate effects on mountain plants. Nature, 1994. 369: p. 448. 3. Guisan, A. and J.-P. Theurillat, Assessing alpine plant vulnerability to climate change: a modeling perspective. Integrated Assessment, 2000. 1: p. 307-320. 4. Parmesan, C. and G. Yohe, A globally coherent fingerprint of climate change impacts across natural systems. Nature, 2003. 421: p. 37-42. 5. Thuiller, W., et al., Climate change threats to plant diversity in Europe. Proceedings of the National Academy of Sciences, 2005. 102(23): p. 8245-8250. 6. Grindl, W., Climatic significance of light rings in timber-line spruce, Picea abies, Austrian Alps. Arctic, Antarctic, and Alpine Research, 1999. 31: p. 242-246. 7. Paulsen, J., U.M. Weber, and C. Körner, Tree growth near treeline: abrupt or gradual reduction with altitude. Arctic, Antarctic, and Alpine Research, 2000. 32: p. 14-20. 8. Motta, R. and P. Nola, Growth trends and dynamics in sub-alpine forest stands in the Varaita Valley (Piedmont, Italy) and their relationships with human activities and global change. Journal of Vegetation Science, 2001. 12: p. 219-230. ACKNOWLEDGEMENTS Special thanks to Ann Dennis, Connie Millar, Robert Westfall, Jim and Catie Bishop, and the Kueppers Lab at UC Merced. Funding for analyses provided by UC Merced.

