Snowpack and seasonal low flows in the Sierra Nevada:
advertisement
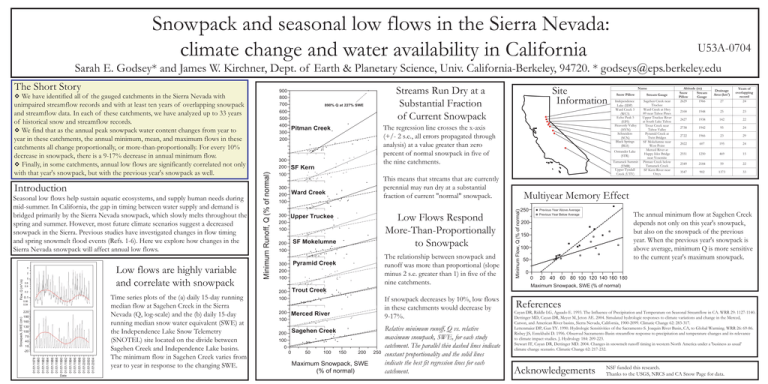
Snowpack and seasonal low flows in the Sierra Nevada: climate change and water availability in California U53A-0704 Sarah E. Godsey* and James W. Kirchner, Dept. of Earth & Planetary Science, Univ. California-Berkeley, 94720. * godseys@eps.berkeley.edu Introduction Seasonal low flows help sustain aquatic ecosystems, and supply human needs during mid-summer. In California, the gap in timing between water supply and demand is bridged primarily by the Sierra Nevada snowpack, which slowly melts throughout the spring and summer. However, most future climate scenarios suggest a decreased snowpack in the Sierra. Previous studies have investigated changes in flow timing and spring snowmelt flood events (Refs. 1-6). Here we explore how changes in the Sierra Nevada snowpack will affect annual low flows. Low flows are highly variable and correlate with snowpack 4 Flow, Q (m^3/s) 2 1 0.6 0.4 890% Q at 227% SWE 600 500 400 300 200 300 200 SF Kern 100 300 100 300 0.1 0.06 0.04 190 160 130 100 70 40 10 01/01/1978 01/01/1980 01/01/1982 01/01/1984 01/01/1986 01/01/1988 01/01/1990 01/01/1992 01/01/1994 01/01/1996 01/01/1998 01/01/2000 01/01/2002 01/01/2004 -20 Date Time series plots of the (a) daily 15-day running median flow at Sagehen Creek in the Sierra Nevada (Q, log-scale) and the (b) daily 15-day running median snow water equivalent (SWE) at the Independence Lake Snow Telemetry (SNOTEL) site located on the divide between Sagehen Creek and Independence Lake basins. The minimum flow in Sagehen Creek varies from year to year in response to the changing SWE. Low Flows Respond More-Than-Proportionally to Snowpack Upper Truckee 200 100 SF Mokelumne 200 100 The relationship between snowpack and runoff was more than proportional (slope minus 2 s.e. greater than 1) in five of the nine catchments. Pyramid Creek 300 200 100 Trout Creek 100 200 If snowpack decreases by 10%, low flows in these catchments would decrease by 9-17%. Merced River 100 Sagehen Creek 200 100 0 0 50 100 150 200 Maximum Snowpack, SWE (% of normal) 250 Relative minimum runoff, Q vs. relative maximum snowpack, SWE, for each study catchment. The parallel thin dashed lines indicate constant proportionality and the solid lines indicate the best fit regression lines for each catchment. Name Snow Pillow Stream Gauge Independence Lake (IDP) Ward Creek 3 (WC3) Echo Peak 5 (EP5) Heavenly Valley (HVN) Schneiders (SCN) Black Springs (BLS) Sagehen Creek near Truckee Ward Creek at Hwy 89 near Tahoe Pines Upper Truckee River at South Lake Tahoe Trout Creek near Tahoe Valley Pyramid Creek at Twin Bridges SF Mokelumne near West Point Merced River at Happy Isles Bridge near Yosemite Pitman Creek below Tamarack Creek SF Kern River near Onyx Ostrander Lake (STR) Tamarack Summit (TMR) Upper Tyndall Creek (UTY) This means that streams that are currently perennial may run dry at a substantial fraction of current "normal" snowpack. Ward Creek 200 Site Information The regression line crosses the x-axis (+/- 2 s.e., all errors propagated through analysis) at a value greater than zero percent of normal snowpack in five of the nine catchments. Pitman Creek 200 0.2 220 Snowpack, SWE (cm) 700 Minimum Runoff, Q (% of normal) % We have identified all of the gauged catchments in the Sierra Nevada with unimpaired streamflow records and with at least ten years of overlapping snowpack and streamflow data. In each of these catchments, we have analyzed up to 33 years of historical snow and streamflow records. % We find that as the annual peak snowpack water content changes from year to year in these catchments, the annual minimum, mean, and maximum flows in these catchments all change proportionally, or more-than-proportionally. For every 10% decrease in snowpack, there is a 9-17% decrease in annual minimum flow. % Finally, in some catchments, annual low flows are significantly correlated not only with that year's snowpack, but with the previous year's snowpack as well. Streams Run Dry at a Substantial Fraction of Current Snowpack 900 800 Altitude (m) Snow Stream Pillow Gauge 2629 1966 27 Years of overlapping record 24 Drainage Area (km2) 2100 1948 25 23 2427 1938 142 22 2738 1942 95 24 2722 1966 23 29 2022 607 195 24 2551 1250 469 15 2349 2184 59 22 3547 902 1373 33 Multiyear Memory Effect Minimum Flow, Q (% of normal) The Short Story 250 Previous Year Above Average Previous Year Below Average The annual minimum flow at Sagehen Creek depends not only on this year's snowpack, but also on the snowpack of the previous year. When the previous year's snowpack is above average, minimum Q is more sensitive to the current year's maximum snowpack. 200 150 100 50 0 0 20 40 60 80 100 120 140 160 180 Maximum Snowpack, SWE (% of normal) References Cayan DR, Riddle LG, Aguado E. 1993. The Influence of Precipitation and Temperature on Seasonal Streamflow in CA. WRR 29: 1127-1140. Dettinger MD, Cayan DR, Meyer M, Jeton AE. 2004. Simulated hydrologic responses to climate variations and change in the Merced, Carson, and American River basins, Sierra Nevada, California, 1900-2099. Climatic Change 62: 283-317. Lettenmaier DP, Gan TY. 1990. Hydrologic Sensitivities of the Sacramento-S. Joaquin River Basin, CA, to Global Warming. WRR 26: 69-86. Risbey JS, Entekhabi D. 1996. Observed Sacramento Basin streamflow response to precipitation and temperature changes and its relevance to climate impact studies. J. Hydrology 184: 209-223. Stewart IT, Cayan DR, Dettinger MD. 2004. Changes in snowmelt runoff timing in western North America under a 'business as usual' climate change scenario. Climatic Change 62: 217-232. Acknowledgements NSF funded this research. Thanks to the USGS, NRCS and CA Snow Page for data.


