Generation of Land Disaster Risk Map from LANDSAT TM ... Institute of Industrial Science, The University of Tokyo.
advertisement
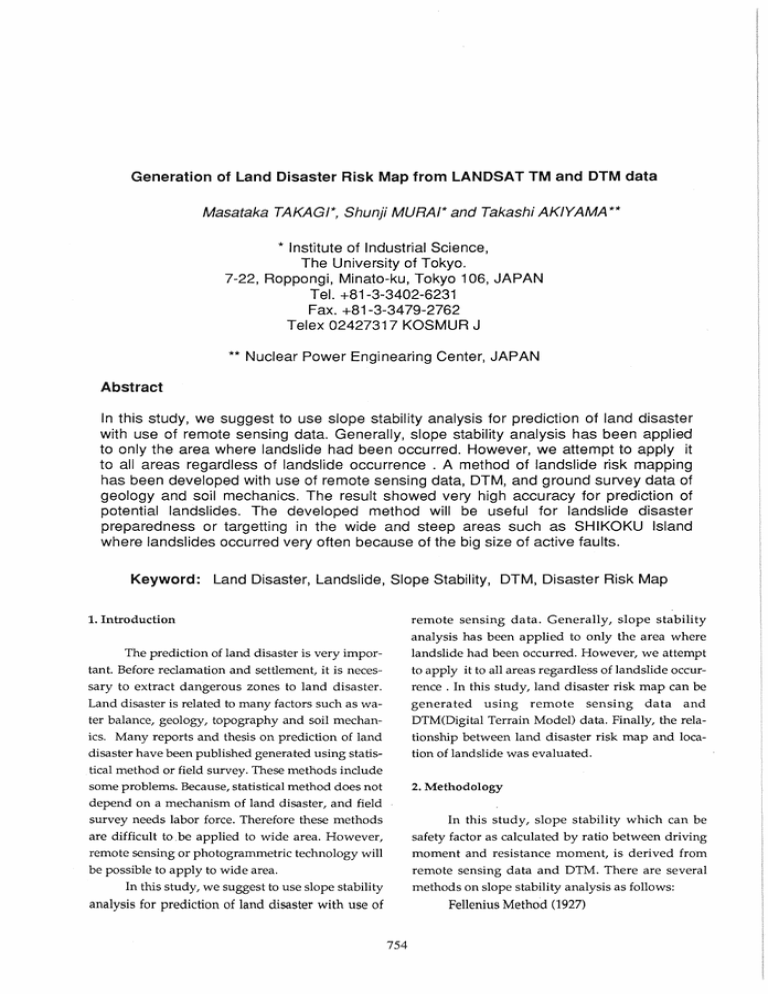
Generation of Land Disaster Risk Map from LANDSAT TM and DTM data Masataka TAKAGI*, Shunji MURAI* and Takashi AKIYAMA ** * Institute of Industrial Science, The University of Tokyo. 7-22, Roppongi, Minato-ku, Tokyo 106, JAPAN Tel. +81-3-3402-6231 Fax. +81-3-3479-2762 Telex 02427317 KOSMUR J ** Nuclear Power Enginearing Center, JAPAN Abstract In this study, we suggest to use slope stability analysis for prediction of land disaster with use of remote sensing data. Generally, slope stability analysis has been applied to only the area where landslide had been occurred. However, we attempt to apply it to all areas regardless of landslide occurrence . A method of landslide risk mapping has been developed with use of remote sensing data, DTM, and ground survey data of geology and soil mechanics. The result showed very high accuracy for prediction of potential landslides. The developed method will be useful for landslide disaster preparedness or targetting in the wide and steep areas such as SHIKOKU Island where landslides occurred very often because of the big size of active faults. Keyword: Land Disaster, Landslide, Slope Stability, DTM, Disaster Risk Map 1. Introduction remote sensing data. Generally, slope stability analysis has been applied to only the area where landslide had been occurred. However, we attempt to apply it to all areas regardless of landslide ocCurrenee. In this study, land disaster risk map can be generated using remote sensing data and DTM(Digital Terrain Model) data. Finally, the relationship between land disaster risk map and location of landslide was evaluated. The prediction of land disaster is very important. Before reclamation and settlement, it is necessary to extract dangerous zones to land disaster. Land disaster is related to many factors such as water balance, geology, topography and soil mechanics. Many reports and thesis on prediction of land disaster have been published generated using statistical method or field survey. These methods include some problems. Because, statistical method does not depend on a mechanism of land disaster, and field survey needs labor force. Therefore these methods are difficult to ,be applied to wide area. However, remote sensing or photogrammetric technology will be possible to apply to wide area. In this study, we suggest to use slope stability 2. Methodology In this study, slope stability which can be safety factor as calculated by ratio between driving moment and resistance moment, is derived from remote sensing data and DTM. There are several methods on slope stability analysis as follows: analysis for prediction of land disaster with use of Fellenius Method (1927) 754 Fig.1 .. b Illustration of Each Slice N I I I I I I ~~ OEM I Length of Landslide Grid Size Fig.1-a Illustration of Felienius Method Bishop Method (1955) Jamb Method (1957) Morgenstern Method (1965) Spancer Method (1968) In this study, Fellenius method was selected, because, number of unknown coefficients is less than other methods, so that it is easy to calculate automatically by computer. In this method, landslide type is assumed rotational slip(Fig.1-a). Moreover, when landslide soil is divided into some slices in order to calculate moment along the critical circle. Therefore, some parameters shall be calculated as follows: R: Radius of Critical Circle (m) W: ex: Weight of Each Slice (tim) Angle between Horizontal Axis and the Base of Slice (degree) L: Length of the Base of Slice (m) C: Cohesion (t/m2 ) <1>: Angle of Shearing Resistance (degree) Using these parameters, on each slice(Fig.1-b), driv- ing moment(T) and resistance moment(N) are calculated by the following equation. T = R W· sin a N = R(C· L + tan<j>· W· cos a) Eq.1 Eq.2 W=Yt A Yt : Wet Unit Weight of Soil (tJm3 ) A: Area of Slice (m2) Therefore safety factor(Fs) is calculated by the following equation. Fs = :EN :ET Eq.3 The above parameters involved in Eq.1 and Eq.2 will be estimated or calculated with remote sensing data and DTM as follows: 1. At each pixel, slope direction is determined fromDEM. 2. Profile is drown up along this direction. 3. Length and depth of landslide which give radius of the critical circle can be determined from ground truth data. 4. Parameters of C and <1> are determined from 755 Fig.2 LANDSAT TM Image(Ch.1,2,4) Fig.3 DEM Shading Image 25 20 ~ c 15 CD 5- 10 CD l.... u.. 5 20 40 60 80 100 120 140 160 180 200 220 240 Length of Landslide (m) Fig.5 Histogram of Landslide Length 10 8 Quartz-Schist Meta-Diabase Sand-Stone Fig.4 Geological Image 5 10 15 20 25 30 Depth of Landslide (m) Fig.6 Histogram of Landslide Depth 756 35 geological map or remote sensing data based on experimental data. 5. Safety factor is calculated by Fellenius method. 30 ;g ~ >. 0 3. Materials c 15 Q) Q) 4. Determination of Parameters 87 landslide areas on SHIKOKU Island were sampled to obtain the parameters as follows .. 20 ::::l 0- In this study, selected test area is the Central SHIKOKU Island, Japan. This area is very complex on geological feature, and many landslides occurred. The size of test area is about 13km * 14km. We selected LANDSAT TM data for remote sensing data, because it has high resolution (30m / pixel) with 6 channels which include thermal region(Fig.2). The data were acquired on May 8, 1985. DEM (Digital Elevation Model) data were generated from 1:25000 topographical map(Fig.3). Geological data were generated by converting the 1:50000 geological map to raster type data(Fig.4). All data were resampled in 30111: grid size in order to allow the overlay. 25 L.t 10 5 0 1.4 1.5 1.6 1.7 1.8 1.9 2.0 2.1 2.2 2.3 Wet Unit Weight of Soil (tlm 3 ) Fig.7 Histogram of Wet Unit Weight o Unsaturated Soil X Satu rated Soil 10 ~ ~ c 'w0 Q) .c 0 0 4-1 Estimation of Landslide Scale Fig.5 shows the histogram of landslide length, while Fig.6 shows the one of landslide depth. The most frequent landslide has 60 meters in landslide length and 10 meters in landslide depth. However, mainly due to the low resolution of LANDSAT TM(30m), the bigger scale of landslide was selected as a target for land disaster risk mapping in this study. In this respect, 240 meters in landslide length and 30 meters in landslide depth were set up for the study, which gave the radius of the critical circle(R = 600 - 800 meters). 9 8 7 6 0 B 0 X 5 4 3 2 1 0 0 DO o 000 0 roo O 0 X ~ X 10 15 8 'oJ DO D~~ 20 0 25 D Xo X xgX;x X 0 X ~ X X X Yx ~)lx )~)(XX XX X X X 5 0 0 0 30 >u~ 0 . Xo 35 40 Angle of Shearing Resistance (Degree) Fig.S Relationship between Cohesion and Angle of Shearing Resistance Table 1 Geology and Shearing Force Geology Quartz-Schist Meta-Diabase Sand-Stone 4-2 Estimation of Soil Mechanics - Unit Weight of Soil: Wet unit weight of soil was measured in the field survey as shown in (Fig.7). From this graph, unit weight of soil of 1.9 t/ m3• - Cohesion and Angle of Shearing Resistance: 757 C (t/m2) 2.0 3.0 4.0 15 20 25 Cohesion and angle of shearing resistance were measured by direct shear test. Relationship between cohesion and angle of shearing resistance is shown in (Fig.8). The cohesion ranges from 2 to 7 t/m2, while the angle of shearing resistance range from 15 to 40 degree for unsaturated. These parameters according to the geological feature. There are three types of geology in the test area, which are quartzschist, meta-diabase and sand-stone. The parameters with respect to the geological types were assummed as listed in (Table 1). 4-3 Reduction of Cohesion by Water Content There is a problem about determination of cohesion, because it was assumed for unsaturated soil. Cohesion varies according to soil moisture. For example, in case of saturated soil, cohesion reduces to a half(Fig.8). Therefore, cohesion must be reduced according to water content or landcover. Fig.9 shows Grass land Water the landcover map generated from LANDSAT TM image. Landcover was classified into 4 class(Water area, Grassland, Forest and Bare soil) by maximum likelihood method. Table2 shows the reduction ratio for cohesion. Bare Soil Forest Fig.9 Landcover Map 5. Result A landslide risk map was generated by using the above parameters as shown in Fig.l0. Landslide area which occurred in the past are marked as simbol of square on this map. From this map, about 90 percent of occurred landslides were located on the dangerous area where safety factor is smaller than 1.0. Even though the parameters used in this study were assumpted roughly, the results shows a very reliable risk map. 6. Conclusion In this study, a method of landslide risk mapping has been developed with use of remote sensing data, DTM, and ground survey data of geology and soil mechanics. The result showed very high accuracy for prediction of potential landslides. The developed method will be useful for landslide disaster 758 Table 2 Landcover and Reduction Ratio Landcover Water Area Grass Land Forest Area Bare Soil Area Reduction Ratio for Cohesion 0.5 0.7 1.0 1.0 preparedness or targetting in the wide and steep areas such as SHIKOKU Island where landslides occurred very often because of the big size of active faults. References (1) Masataka TAKAGI, Tadaharu NAKAMURA and Sadaki MIY AUCHI "Distribu tion of Landslide Occurred in SHIKOKU ISLAND" Journal of Japan Landslide Society, 26-3, pp.4752, 1989 (in Japanese) (2) Masataka TAKAGI, Tadaharu NAKAMURA and Sadaki MIYAUCHI "Gradient of Ground surface in Landslide Area" Journal of Japan Landslide Society, 26-4, pp.2936, 1989 (in Japanese) (3) Masataka TAKAGI, Tadaharu NAKAMURA and Sadaki MIY AUCHI "Foundation and Groundwater in Landslide Area in Ehime Prefecture, Japan" Journal of Japan Landslide Society, 27-2, pp.1722, 1990 (in Japanese) (4) Masataka TAKAGI and Shunji MURAl "Inference of Landslide Area from LANDSAT TM and DTM Data" Proceedings of 11th ACRS, pp.J-4-1 - J-4-5, 1991 0.2 0.4 0.6 0.8 1.0 1.2 1.4 1.6 Fig.10 Land Disaster Risk Map 759

