FINAL REPORT OF V.G. IV/4: ... J. Kure, M.M. Radwan
advertisement
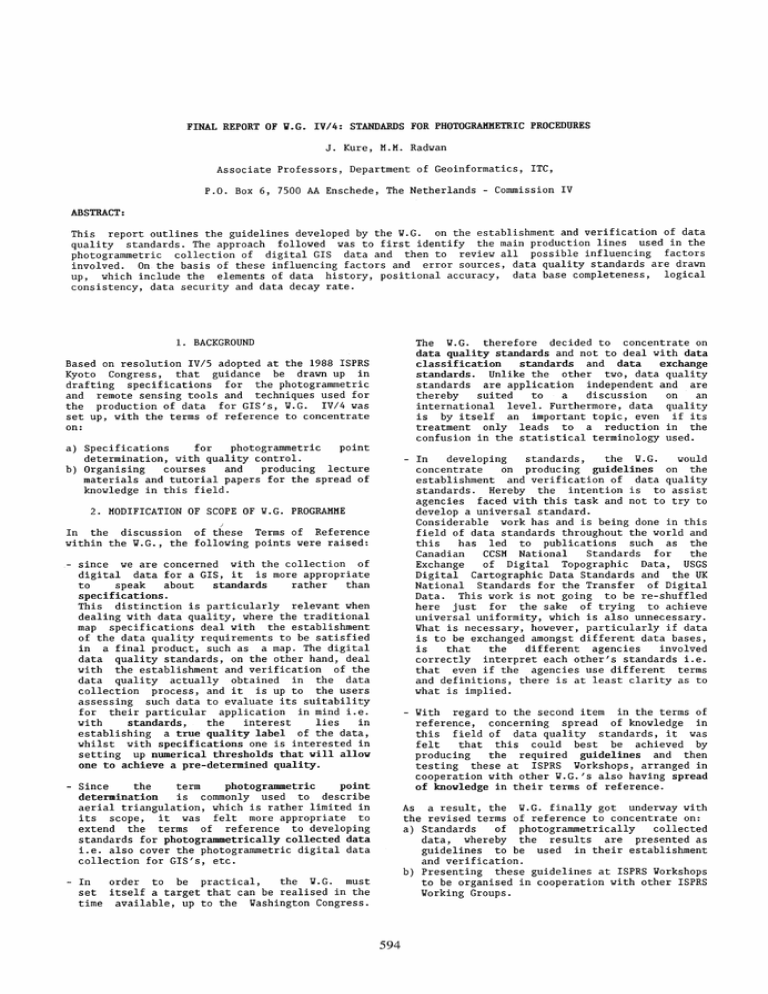
FINAL REPORT OF V.G. IV/4: STANDARDS FOR PHOTOGRAHHETRIC PROCEDURES J. Kure, M.M. Radwan Associate Professors, Department of Geoinformatics, lTC, P.O. Box 6, 7500 AA Enschede, The Netherlands - Commission IV ABSTRACT: This report outlines the guidelines developed by the V.G. on the establishment and verification of data quality standards. The approach followed was to first identify the main production lines used in the photogrammetric collection of digital GIS data and then to review all possible influencing factors involved. On the basis of these influencing factors and error sources, data quality standards are drawn up, which include the elements of data history, positional accuracy, data base completeness, logical consistency, data security and data decay rate. 1. BACKGROUND The V.G. therefore decided to concentrate on data quality standards and not to deal with data classification standards and data exchange standards. Unlike the other two, data quality standards are application independent and are thereby suited to a discussion on an international level. Furthermore, data quality is by itself an important topic, even if its treatment only leads to a reduction in the confusion in the statistical terminology used. Based on resolution IV/s adopted at the 1988 ISPRS Kyoto Congress, that guidance be drawn up in drafting specifications for the photogrammetric and remote sensing tools and techniques used for the production of data for GIS's, V.G. IV/4 was set up, with the terms of reference to concentrate on: a) Specifications for photogrammetric point determination, with quality control. b) Organising courses and producing lecture materials and tutorial papers for the spread of knowledge in this field. - In developing standards, the W.G. would concentrate on producing guidelines on the estabiishment and verification of data quality standards. Hereby the intention is to assist agencies faced with this task and not to try to develop a universal standard. Considerable work has and is being done in this field of data standards throughout the world and this has led to publications such as the Canadian CCSM National Standards for the Exchange of Digital Topographic Data, USGS Digital Cartographic Data Standards and the UK National Standards for the Transfer of Digital Data. This work is not going to be re-shuffled here just for the sake of trying to achieve universal uniformity, which is also unnecessary. What is necessary, however, particularly if data is to be exchanged amongst different data bases, is that the different agencies involved correctly interpret each other'S standards i.e. that even if the agencies use different terms and definitions, there is at least clarity as to what is implied. 2. MODIFICATION OF SCOPE OF V.G. PROGRAMME / In the discussion of these Terms of Reference within the V.G., the following points were raised: - since we are concerned with the collection of digital data for a GIS, it is more appropriate to speak about standards rather than specifications. This distinction is particularly relevant when dealing with data quality, where the traditional map specifications deal with the establishment of the data quality requirements to be satisfied in a final product, such as a map. The digital data quality standards, on the other hand, deal with the establishment and verification of the data quality actually obtained in the data collection process, and it is up to the users assessing such data to evaluate its suitability for their particular application in mind i.e. with standards, the interest lies in establishing a true quality label of the data, whilst with specifications one is interested in setting up numerical thresholds that will allow one to achieve a pre-determined quality. - With regard to the second item in the terms of reference, concerning spread of knowledge in this field of data quality standards, it was felt that this could best be achieved by producing the required guidelines and then testing these at ISPRS Workshops, arranged in cooperation with other W.G.'s also having spread of knowledge in their terms of reference. - Since the term photogrammetric point determination is commonly used to describe aerial triangulation, which is rather limited in its scope, it was felt more appropriate to extend the terms of reference to developing standards for photogrammetrically collected data i.e. also cover the photogrammetric digital data collection for GIS's, etc. As a result, the W.G. finally got underway with the revised terms of reference to concentrate on: a) Standards of photogrammetrically collected data, whereby the results are presented as guidelines to be used in their establishment and verification. b) Presenting these guidelines at ISPRS Workshops to be organised in cooperation with other ISPRS Working Groups. - In order to be practical, the V.G. must set itself a target that can be realised in the time available, up to the Vashington Congress. 594 lateral overlap to obtain double tie points; etc.) 3. GUIDELINES ON THE ESTABLISHMENT AND VERIFICATION OF DATA QUALITY STANDARDS Most of the attention in this paper will be directed towards setting up standards for the two main elements of the data quality standards, POSITIONAL ACCURACY and ATTRIBUTE ACCURACY. These standards will be looked into for three main production lines; point determination, photogrammetric data collection and digitising existing maps. Hereby, the error sources will be evaluated after each of the successive production phases of data collection, data storage and processing and finally, data presentation. The measuring errors are confined to pointing errors if the bundle method is used and to relative orientation plus pointing errors for the IMT method. The accuracy standards of aerial triangulation are readily established and verified, simply because they form an integral part of the A.T. results. The golden rule in establishing A.T. accuracy standards is therefore to resort to your own A.T. figures. The discussion in the paper then turns to the other elements within data quality standards such as DATA HISTORY, LOGICAL CONSISTENCY, DATA SECURITY and DATA DECAY, where the main question will be whether some of these elements could not be more usefully incorporated into the accuracy elements. However, in order to have some figures for discussion and comparison purposes with other accuracy standards, examples of figures obtainable in High Precision AT's and Precision AT's are accuracies of respectively 5~m and 10~m at photo scale. Hereby it must be borne in mind that the high precision A.T. involves bundle adjustment, signalised control and tie points, perimeter plan control at two to three model intervals, correction for systematic image errors and possibly also systematic errors in the measuring instrument used. Also, the less stringent requirements for a precision A.T. still involve bundle or IMT adjustment,perimeter plan control at three to four model intervals, signalised control points, multiple tie points in each location and, if possible, double rows of lateral tie points. 3.1 Positional accuracy standards In this presentation, the accuracy is expressed as a standard deviation in metres on the ground, but of course can be readily transformed to any other system in use. Absolute accuracy measures are given, but these imply error in relation to nearby control points and not a distant origin of the coordinate system, simply because they are based on the equivalence of relative and absolute accuracy in an aerial triangulation with a high density of control. On the basis of these examples, a table can be drawn up for the accuracy of the photogrammetric point determination phase. (units m) Finally, these guideline standards only cover planimetric accuracy. Full standards have been produced and can be made available, on request. t::s:e of triangulation are available, such PRECISION, PRECISION, STANDARD, etc. as HIGH Phase I: data collection This initial phase of data collection covers the whole aerial triangulation process. The input errors include the errors in ground control (measuring equipment and method used), the effect of the ground control requirements on the total process (density and distribution of control, number of control points in each location, the signalisation of control), errors in the aerial photography (type of camera, photo scale, film deformation, lens distortion), errors in the preparation phase (point transfer errors, if signalised tie points are not used) and the effect of the A.T. requirements on the process (instrument to be used; method, bundle or IMT; use of single or mUltiple tie points; use of increased -- High AT Precision Precision AT Photo sca e~ AT 3.1.1 Point determination applications The main applications of aerial triangulations are: - the determination of minor control for digital and analogue mapping - the densification of geodetic control networks - numerical and graphical cadastral surveys In order to satisfy the widely varying accuracy requirements (point determinations ranging from a few centimetres to decimetres or even metres on the ground), different types of aerial rows of lateral 1:50,000 1:30,000 1:10,000 1 : 5,000 1 : 2,500 0.25 0.15 0.05 0.03 0.01 0.50 0.30 0.10 0.05 0.03 Table 1: Photogrammetric point determination Phase II: data storage and processing Since no further processing takes place with regard to the aerial triangulation and no rounding off errors, etc. will take place with storage, the accuracy standard after storage and processing will be the same as that shown in table 1, after data collection. Phase III: data presentation A graphical plot is quite often required as an additional product in a numerical cadastral survey_ As the standard accuracy of this plotting error is 0.15 mm at map scale, there is a considerable loss in accuracy of the graphical as compared to the original digital data. This can be verified in the table below, showing the accuracy of the graphical plot of photogrammetric point data. 595 (units m) ~scale 1:10,000 1:5,000 1:2,500 1:1,000 - the identification accuracy for different features and different feature definitions is obtainable from repeated model measurements at these features. 1:500 photo scale '--.... 1:50,000 1:30,000 1:10,000 1 : 5,000 1: 2,500 1.58 1.53 1.50 1.50 1.50 0.90 0.81 0.76 0.75 0.75 0.63 0.48 0.39 0.38 0.38 0.52 0.34 0.18 0.16 0.15 0.51 0.31 0.13 0.09 0.08 1:50,000 1:30,000 1:10,000 1 : 5,000 1 : 2,500 1.52 1.51 1.50 1.50 1.50 0.79 0.76 0.75 0.75 0.75 0.45 0.40 0.38 0.38 0.38 0.29 0.21 0.16 0.15 0.15 0.26 0.17 0.09 0.08 0.08 It is, of course, a tremendous task to build up this data base for the identification accuracy of different features, particularly since this accuracy varies with feature definition (i.e. centre of road or edge of road) and with the photo scale used. This task will unquestionably become part of the checking operations. In order to have figures for discussion and comparison purposes, the following realistic assumptions are made, using figures obtained in practice: _ A.T. accuracy: cr = 10 ~m at photo scale, for a precise A.T., which is sufficiently accurate for all mapping purposes _ measuring accuracy: cr = 15 ~m at photo scale Table 2: Graphical plot of photogrammetric point datal Precision AT j High Precision AT ) 3.1.2 Photogrammetric digital data collection Photogrammetric digital data collection is equivalent to digital mapping, whereby the resulting digital data is either stored in one or several data bases for further processing within a GIS or is used to produce or up-date graphical maps. - identification accuracy: control point wall hedge, ditch canal bank river bank Phase I: data collection This initial phase of data collection covers the whole mapping process. The input errors include the errors in ground control and aerial photography (as outlined in 3.1.1), in addition to the aerial triangulation errors: point transfer errors; system errors depending upon the number and distribution of tie points and measuring errors which vary with the type of point (signalised or pricked) and further depend on image quality, object quality, the measuring instrument, the base-height ratio and observer acuity. 0 5 10 20 50 cm cm cm cm cm From these figures, the following table can be drawn up for the accuracy of photogrammetric digital data collection. (units m) ~~tif. error o cm 5 cm 10 cm 20 cm 50 cm i.oo 1.02 0.63 0.28 0.22 0.21 1.12 0.78 0.54 0.51 0.50 Photo scale"" 1:50,000 1:30,000 1:10,000 1: 5,000 1: 2,500 The measuring errors include errors in the relative and absolute orientations; measuring errors, which vary depending on whether the measuring mode is static or dynamic and, in the latter case, the measuring speed; the image quality; the base-height ratio; the object quality, including parameters such as terrain slope, vegetation coverage, etc.; the instrument errors; the operator acuity; etc. A separate component of the measuring error is the identification error, which varies with the definition of the feature being measured i.e. corner of a house or boundary of a forest. Identification errors also arise if the definition of the feature to be picked up is not clear enough e.g. if it is not clear whether the boundary of a canal is to be taken as the top of the bank or the water line, etc. 1.00 0.60 0.20 0.10 0.05 1.00 0.60 0.21 0.11 0.07 0.61 0.22 0.14 0.11 Table 3: Photogrammetric digital data collection Note: The first column in the above table gives the intrinsic accuracy of the digital data base i.e. the accuracy excluding a possible identification error. Phase II: data storage and processing Since no further processing takes place until the data are eventually incorporated into a GIS, the accuracy of the photogrammetric data after initial storage and processing will be the same as that shown in figure 3, after data collection. The accuracy standards for the digital mapping phase are not difficult but are time-consuming to establish and verify. Phase III: data presentation A graphical plot is a quite normal requirement to be produced from photogrammetric digital data. With a standard plotting accuracy of 0.15 ~m at map scale, tables can be drawn up showing the accuracy of the graphical plot of photogrammetric digital data collection. Note, however, that different tables are needed for the different values of the identification error. The table given below refers to intrinsic data i.e. with no identification error. Looking to the components involved, the A.T. accuracy is obtained from the A.T. results the measuring accuracy is obtainable from repeated model measurements, such as occur in checking operations. The coordinate differences used should only refer to well-defined points i.e. those without an identification error 596 (units m) ~~al' 1: 10,000 1:5,000 1:2,500 1:1,000 0.71 0.55 0.42 0.39 0.39 0.62 0.43 0.25 0.18 0.16 (units m) map scale 1:500 photo sea e ............ 1:30,000 1:20,000 1:10,000 1: 5,000 1: 2,500 1.62 1.55 1. 51 1.50 1.50 0.96 0.85 0.78 0.76 0.75 1:50,000 1:25,000 1:10,000 1 : 5,000 1 : 2,500 1 : 1,000 0.60 0.41 0.21 0.12 0.09 Table 4: Graphical plot of photogrammetric digital data (with no identification error) (] 17.50 8.75 3.50 1. 75 0.88 0.35 Table 5: Digitised map data (excl. identification and generalisation errors) 3.1.3 Digitising existing maps Digitising existing maps is an attractive alternative to photogrammetric digital data collection in order to set up a digital data base. In the feasibility study, however, careful consideration must be given to the following two issues: - the age of the maps and the rate of development of the area concerned, which determine the number of changes and hence the revision effort required. In this context, changes also imply changes in the map content requirements, since the original maps were produced - in view of the loss of accuracy through the digitising process, one will in general want to digitise at a larger map scale than has to be finally plotted and this, of course, reduces the economic attractiveness. Phase II: data storage and presentation Since no further processing takes place until this data is incorporated into a GIS, the accuracy of the digitised map data after initial storage and processing will be in the same as that after data collection, shown in table 5. Phase III: data presentation A graphical plot is quite a normal requirement to be produced from digitised map data. The accuracy of this graphical plot is determined from the accuracy of the digitised map data and the plotting accuracy, which can be taken to be 0.15 mm at plotting scale. Note, however, that different tables are needed for the different values of the identification and generalisation error. The table given below refers to the intrinsic data accuracy i.e. accuracy excluding identification and generalisation error. Phase I: data collection This initial data collection phase covers the whole digitising process. The input errors are the positional errors in the map original. In evaluating these, account will have to be taken of the original production method and parameters used such as photo scale, control distribution in the A.T., etc. etc.; the original accuracy specifications (which imply a standard deviation of 0.3 mm at map scale with the standard specifications of "90% within 0.5 mm", but only applicable to well-defined features); the identification errors to be added to all other non well-defined feature classes and finally the generalisation errors introduced in the form of feature displacements, during the cartographic phase. (units m) ~ plotting digi tising '-....... scale 1: 50,000 1: 25,000 1: 10,000 1: 5,000 1: 2,500 1: 1,000 scale ~ 1:50,000 1: 25,000 1:10,000 1: 5,000 1: 2,500 1: 1,000 19.04 11.52 8.28 7.70 7.55 7.51 9.52 5.13 4.14 3.85 3.77 3.81 2.30 1. 74 1.54 1. 90 1.15 0.82 0.95 0.51 0.38 Table 6: Graphical plot of digitised map data (excl. identification and generalisation errors) 3.2 Attribute accuracy standards The measuring errors in the digitising process vary with the digitising method used: point digitising and the sampling density in relation to Attribute accuracy expresses the correctness and completeness of the digital data stored in a data base and is built-up from an evaluation of the following different characteristics defining the quality of the digital data: - data classification: have errors been made in not going to a sufficant degree of detail in data collection i.e. streams not further classified as perennial, intermittent, dry; was the feature definition clear enough so that the correct boundary has been picked up i.e. not clear if boundary of a highway area to be taken from cadastral boundaries as depicted by the fences or the limits of the hardened highway surface; has account been taken of temporal changes in the classification system e.g. roads department changes its road classification the complexity of the feature; stream digitising and the digitising speed, again in relation to the nature of the feature; automated scanning in the raster mode and the subsequent raster to vector conversion; automated scanning in the vector mode; the precision of the digitiser or scanner; the map quality (thickness of lines, errors in the original, etc.) and the operator acuity. Assuming an accuracy in the map original of 0.3 mm (excluding identification and generalisation errors) and a digitising accuracy of 0.15 mm, the digitised data will have an accuracy of 0.35 mm at map scale. This is illustrated for different map scales in table 5. 597 system; have temporal changes occurred in spite of a correct classification during the field verification phase i.e. type of crop changed from maize to potatoes and finally have there been any errors in the field verification phase itself. - data completeness, though decisions taken on the extent of the data base content: this aspect of completeness, indicating the extent to which features on the ground are actually included in the data base, is related to the problem of generalisation in the traditional mapping environment. Here, in order to keep the maps readable, fewer and fewer features can be represented as the scales decrease and therefore they are simply not picked up. This type of reasoning does, however, not apply to data bases and so, in terms of assigning a quality label for this type of completeness, the content requirements of different data bases will have to be quantified in relation to the maximum completeness. E.g. assume that a 1:50,000 map series has been found to have an average generalisation percentage of 30%. If now these 1:50,000 maps are digitised to create a data base, the quality indicator for the completeness of the digitised data based only on data base content will be 70%. accessibility to the data due to security restrictions and finally, missing and thereby incomplete data due the fact that the input data has been generalised. This will occur, for example, when the individual buildings have been generalised by the built-up area symbol on a medium scale map and this map is subsequently digitised. In these guidelines, attribute accuracy will be expressed as a percentage of the correctness and completeness of the attribute, in relation to the true situation. There are three of these quality indicators for attribute accuracy: data classification, data completeness related to data base. content and data completeness related to errors in data collection. This implies that the final figure for attribute accuracy is the product of the three figures obtained for the indicators e.g. with figures of 85% for data classification, 90% for completeness (content) and 80% for completeness (errors), the attribute accuracy figure will be 0.61 or 61%. Besides determining the attribute accuracy for each data item class, summaries will also be produced of groups of items falling within different accuracy classes, in order to provide useful indicators for map revision needs. Attribute accuracy is only readily verifiable in the field during the field completion or field verification phase. An exception to this is the figure for data completeness related to data base content, which must come from the organisation's statistical records. Data with a security classification also fall into this category, but the effect on the completeness percentages will depend on whether: a) the security label prevent general access to these elements, whereby the data is de facto entirely removed from the data base. If this concerns 5% of the features in an area, the data completeness percentage become 95% due to security restrictions. b) the above solution has the disadvantage of yielding gaps when a graphical plot is produced. To overcome this, some agencies retain the feature (in simplified form in open areas) and g1ve it a general classification such as government building or government area-restricted. With regard to the simplified form of the security object in open areas, this will generally only include the boundaries of the complex, plus the location of through roads, if the complex has more than one entrance. Besides eliminating gaps, this alternative also increases the data completeness percentage. Some authors advocate that data security be treated as a separate item in attribute accuracy standards, but the majority of W.G. members were in favour of retaining it as an integral element within data completeness, as affected by decisions on the data base content. 3.4 Data history The data history describes the standards themselves and summarises the methods used in data collection and data quality verification. It is probably the most important element in the data quality standards, simply because it allows users accessing the data to correctly interpret the implications of the quality measures used. 3.5 Logical consistency Logical consistency is a general term for fidelity in representing features in a data structure. It thus does not belong to the data collection parameters described in these standards and will not be treated further here. 3.6 Data security Instead of taking this as a separate item, data security has, in these standards, been included as a component of the quality indicator data completeness, in relation to data base content, described in paragraph 3.2. data completeness, expressing the degree to which features which should have been included in the data base, have actually been picked up. The data completeness depends on factors such as the quality of the field verification phase i.e. have all missing features been picked up; the temporal validity of the data i.e. the extent to which all changes have been recognised and new features have been picked up; the lack of 3.7 Data decay The decay rate of data has been mentioned in paragraph 3.2 as being an important factor, affecting the quality of both data classification and data completeness. Nevertheless, decay rate is probably not important enough to be included as a separate item defining quality within the 598 attribute accuracy standards. An complication is that any classification used to define decay rate, will be subjective. added system highly A possible exception in this regard would be to attach a label high decay rate to those attribute items which can change within 6 months, but almost certainly will change within a year. Examples of these are the physical changes in shacks in slum areas; classification changes in type of crop grown on arable land; classification changes in the space use of buildings in city centres, etc. Such warnings, presented by these labels, could be very useful for planning purposes. 4. CONCLUDING REMARKS Quite some effort is involved in setting up standards for data quality, but it has to be done and when done properly, can lead to numerous hidden advantages to management, such as: - users will have more faith in map data, since there is now little room for interpretation errors, which have lead to considerable financial losses in the past. A part of this greater faith arises from the fact that users are now able to evaluate for themselves whether the quality is sufficient for the decisions they have to take - mapping managers can use a lot of the quality indicators for planning purposes. Examples of these are: * the use of the summaries produced of the groups of features falling within different accuracy classes as indicators for map revision needs * if data items have a high decay rate, do not * incorporate these into the national topo data base but transfer them specialised user data bases, where for example agriculturalists interested in predicting maize yield, will only be too happy to record all land use changes involving maize see which conclusions can be derived from the accuracy tables of your organisation. For if the maps produced from the example, photogrammetric digital data collection have to satisfy the plotting accuracy requirement of being within 0.2 mm at map scale, table 4 shows that the maximum enlargement that can be used from photo to map is 6.6x. Similarly, if the maps produced from digitising existing maps also have to satisfy the 0.2 mm accuracy requirement, then table 6 shows that the original maps will have to be at a 2.7 x larger scale. Acknowledgement The authors acknowledge with thanks the assistance received from Y.G. members in supplying the ideas and support in the preparation of this report. 599

