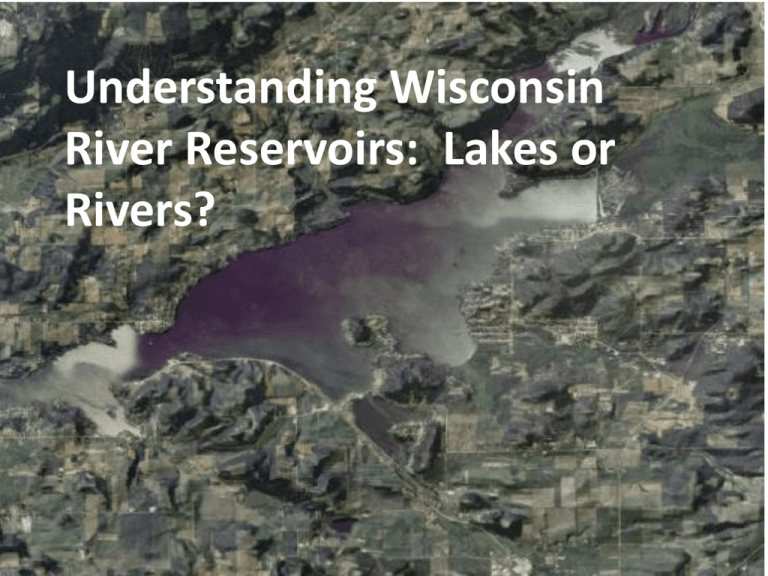
Understanding Wisconsin River Reservoirs: Lakes or Rivers?
advertisement

Understanding Wisconsin River Reservoirs: Lakes or Rivers? Need to recognize Rule #1 (Scott’s Rule) Nutrient and Sediment Transport Systems • Rivers cut and move This is natural! Always going to have some deposition. • Material deposit at low energy and erodes at higher energy (we’re going to use velocity and energy as the same) Rule #2: Need to think in a matrix • Resource management is NOT, A + B = C • It’s this! One action has multiple reactions Now let’s get started…. Fundamentals: Dams Create Reservoirs • http:// So… So, this: Q= vA or v=Q/A • • • • • River slows down when it reaches reservoir A increase; v decreases; Q stays the same Hydraulic Residence Time (HRT) increases “stuff” settles out Some “stuff” increases algae. Remember how TP decreased at outlets… > < v “stuff” settles v Hold on, it’s about to get heavy…. - eminem As HRT increases, the “stuff” in the water (P & N) has more time to increase algal growth. Add heat and droughty conditions, HAB from BGA can increase even more. This leads to decreased water clarity, which increases habitat preference of some AIS like carp. Carp disturb sediment and release nutrients that destroy habit for native species by disturbance and decreased light penetration. HRT=Hydraulic Residence Time P = Phosphorus N = Nitrogen HAB = Harmful Algal Blooms BGA = Blue Green Algae AIS = Aquatic Invasive Species To complicate things: HRT varies amongst reservoirs and within reservoirs • • • • As HRT varies, so does behavior High HRT, acts like a lake Low HRT, acts like a river Stuff settles as HRT increases Statewide Phosphorus (i.e. stuff) Rule Rivers Streams 1 Reservoirs 100 μg/L 75 μg/L • Not Stratified = 40 μg/L • Stratified = 30 μg/L Inland Lakes2 Ranges from 15-30 μg/L Great Lakes • Lake Michigan = 7 μg/L • Lake Superior = 5 μg/L Which one is it? 1All unidirectional flowing waters not in NR 102.06(3)(a). Excludes Ephemeral Streams. 2Excludes wetlands and lakes less than 5 acres Lake Wisconsin as an example • • • • Average summer HRT is <14 days Lake Wisconsin is a RIVER Acts like a lake sometimes As HRT increases; BGA increases Petenwell Reservoir Monitoring Results Lake Wisconsin Total Phosphorus Concentration Northern 90 Central 109 Southern 98 80 90 100 110 2010-2013 Mid-June – Mid Sept (mg/L) What to do: Site Specific Criteria Wisconsin River Basin Phosphorus Criteria - Central/South Brings us to the Wisconsin River TMDL Water Quality Data Assessment, Watershed & Reservoir Modeling 2009 - 2013 2014 Draft TMDL 2015 - Watershed & Reservoir Monitoring - Conceptualization 2016 Allocation Development Baseline TMDL 2017 Final TMDL Main Stem Monitoring Results Total Phosphorus Concentration Tomahawk 65 Merrill 64 Wausau Dam 62 Rothchild 70 Mosinee 75 Below Dubay 95 Point Dam 80 Biron 90 Nekoosa 95 Below Petenwell 81 Below Castle Rock 67 Dells 76 Sauk City 78 0 20 40 60 80 2010-2013 May-Oct Median TP (mg/L) 100 Tributary Monitoring Results Total Phosphorus Concentration West Tributaries 63 78 Spirit Rib Big Eau Pleine 252 129 79 102 Fenwood 175 Prairie 52 Pine 38 Eau Claire 54 Plover 32 Tenmile 51 Big Roche-A-Cri 31 Freeman BEP Outlet Little Eau Pleine 268 East Tributaries Mill 116 Yellow 126 Lemonweir 117 WB Baraboo 169 Baraboo Reedsburg 176 Baraboo 300 200 100 0 2010-2013 May-Oct Median TP (mg/L) 0 100 200 300 2010-2013 May-Oct Median TP (mg/L) We ARE Making Progress Estimated Annual Phosphorous Point Source Loading Phosphorus Discharge (lbs) 800,000 700,000 600,000 500,000 400,000 300,000 200,000 100,000 0 1993 1994 1995 1996 1997 1998 1999 2000 2001 Central WI Basin 2002 2003 2004 2005 2006 2007 Need to Address NPS! One Basin; Two Personalities • • • • East side, tends to be sandy Lower runoff potential Different management Wind erosion One Basin; Two Personalities • West side, tends to be heavier soils • Higher runoff potential • Different management Difficulty of NPS Management • Hard to pinpoint source • Lack of incentives (i.e. rules, $$$, etc.) • Land use patterns – Generational ethos – Local demands – Perceptions Summary • • • • • • • A river we want to be a lake “stuff” (nutrients and sediment) settles Fuels algae, decrease water quality, alters bio Active TMDL – need implementation Progress has been made Work on NPS Prevent AIS Yep, Yep, Yep Thank You! What can we do together? Open Discussion • Show successes – NPS control porjects – PS success – AIS prevention model • Don’t ignore problems • I and E – Political • Bigger picture (i.e. watershed to river valley to continental basin)


