National Center for Education Statistics IPEDS Data Center UnitID Address
advertisement

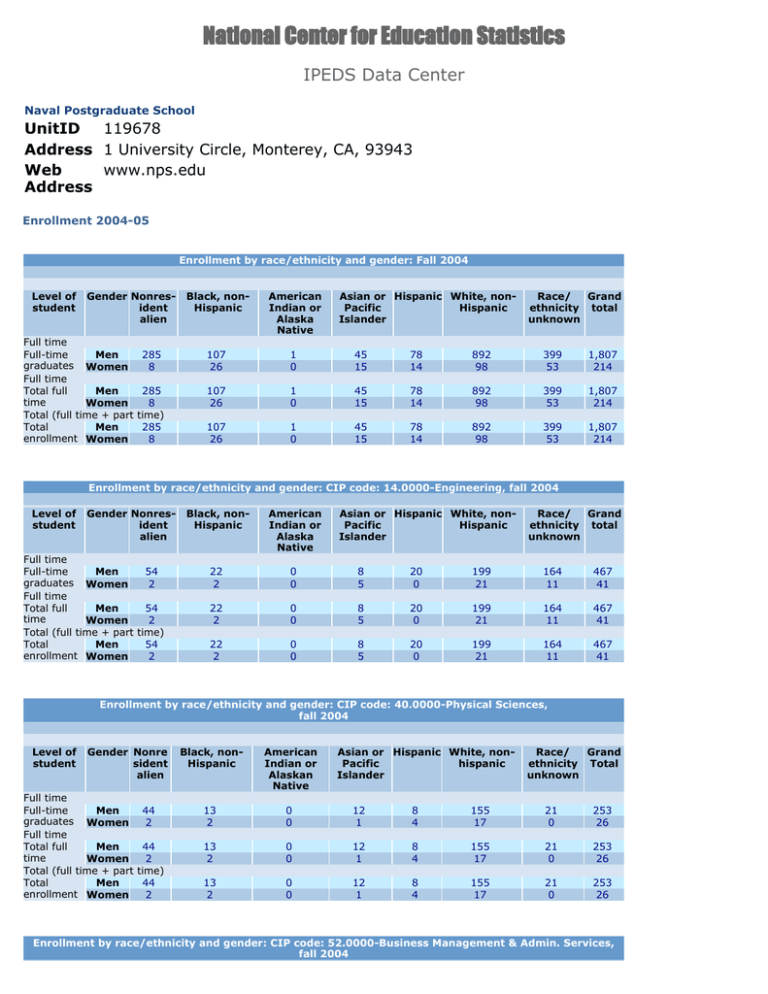
National Center for Education Statistics IPEDS Data Center Naval Postgraduate School UnitID 119678 Address 1 University Circle, Monterey, CA, 93943 Web www.nps.edu Address Enrollment 2004-05 Enrollment by race/ethnicity and gender: Fall 2004 Level of student Gender Nonresident alien Full time Full-time Men graduates Women Full time Total full Men time Women Total (full time + part Total Men enrollment Women Black, nonHispanic American Indian or Alaska Native Asian or Hispanic White, nonPacific Hispanic Islander Race/ Grand ethnicity total unknown 285 8 107 26 1 0 45 15 78 14 892 98 399 53 1,807 214 285 8 time) 285 8 107 26 1 0 45 15 78 14 892 98 399 53 1,807 214 107 26 1 0 45 15 78 14 892 98 399 53 1,807 214 Enrollment by race/ethnicity and gender: CIP code: 14.0000-Engineering, fall 2004 Level of student Gender Nonresident alien Full time Full-time Men 54 graduates Women 2 Full time Total full Men 54 time Women 2 Total (full time + part time) Total Men 54 enrollment Women 2 Black, nonHispanic American Indian or Alaska Native Asian or Hispanic White, nonPacific Hispanic Islander Race/ Grand ethnicity total unknown 22 2 0 0 8 5 20 0 199 21 164 11 467 41 22 2 0 0 8 5 20 0 199 21 164 11 467 41 22 2 0 0 8 5 20 0 199 21 164 11 467 41 Enrollment by race/ethnicity and gender: CIP code: 40.0000-Physical Sciences, fall 2004 Level of student Gender Nonre sident alien Full time Full-time Men graduates Women Full time Total full Men time Women Total (full time + part Total Men enrollment Women Black, nonHispanic American Indian or Alaskan Native Asian or Hispanic White, nonPacific hispanic Islander Race/ Grand ethnicity Total unknown 44 2 13 2 0 0 12 1 8 4 155 17 21 0 253 26 44 2 time) 44 2 13 2 0 0 12 1 8 4 155 17 21 0 253 26 13 2 0 0 12 1 8 4 155 17 21 0 253 26 Enrollment by race/ethnicity and gender: CIP code: 52.0000-Business Management & Admin. Services, fall 2004 Level of student Gender Nonre sident alien Full time Full-time Men graduates Women Full time Total full Men time Women Total (full time + part Total Men enrollment Women Black, nonHispanic American Indian or Alaskan Native Asian or Hispanic White, nonPacific hispanic Islander Race/ Grand ethnicity Total unknown 48 2 49 14 1 0 15 3 29 7 260 28 159 30 561 84 48 2 time) 48 2 49 14 1 0 15 3 29 7 260 28 159 30 561 84 49 14 1 0 15 3 29 7 260 28 159 30 561 84 Full-time enrollment by age: Fall 2004 ( Graduates ) Level of study Graduates Age under 18 18-19 20-21 22-24 25-29 30-34 35-39 40-49 50-64 65 and over Age unknown Total full-time graduates Men Women 73 316 546 377 115 9 1 370 1,807 18 53 50 25 17 3 0 48 214 12-month reporting period Image descripti on. Radio Off End of image descripti on. Image descripti on. Radio On End of image descripti on. July 1, 2003 through June 30, 2004 September 1, 2003 through August 31, 2004 12-month unduplicated student count: 2003-04 Level of Gender Nonresident Black, non- American Asian or Hispanic White, non- Race/ethicity Grand student alien Hispanic Indian or Pacific Hispanic unknown total Alaska Islander Native Total Men 461 138 3 80 99 1,193 427 2,401 Women 14 27 0 19 16 125 50 251 Graduates Men 461 138 3 80 99 1,193 427 2,401 Women 14 27 0 19 16 125 50 251 Instructional Activity Image descripti on. Radio Off End of image descripti on. Image descripti on. Radio Off End of image descripti on. Image descripti on. Radio Off End of image descripti on. Contact hours Credit hours Both contact and credit hours (some programs measured in contact hours and others measured in credit hours)


