National Center for Education Statistics IPEDS Data Center
advertisement
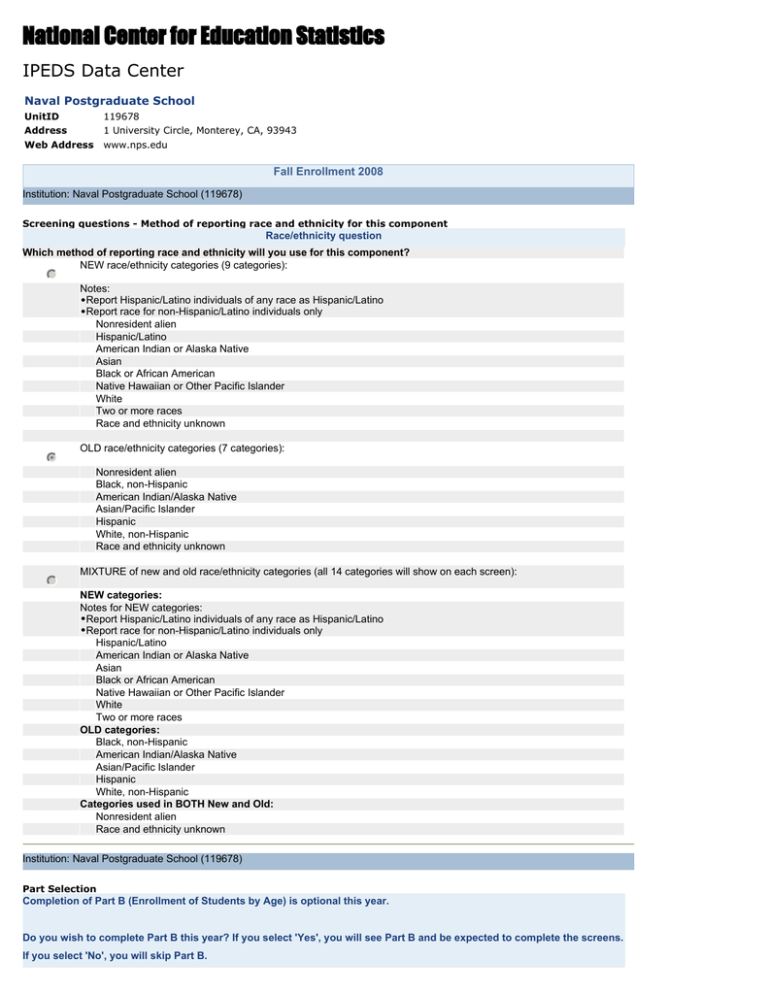
National Center for Education Statistics IPEDS Data Center Naval Postgraduate School UnitID 119678 Address 1 University Circle, Monterey, CA, 93943 Web Address www.nps.edu Fall Enrollment 2008 Institution: Naval Postgraduate School (119678) Screening questions - Method of reporting race and ethnicity for this component Race/ethnicity question Which method of reporting race and ethnicity will you use for this component? NEW race/ethnicity categories (9 categories): Notes: •Report Hispanic/Latino individuals of any race as Hispanic/Latino •Report race for non-Hispanic/Latino individuals only Nonresident alien Hispanic/Latino American Indian or Alaska Native Asian Black or African American Native Hawaiian or Other Pacific Islander White Two or more races Race and ethnicity unknown OLD race/ethnicity categories (7 categories): Nonresident alien Black, non-Hispanic American Indian/Alaska Native Asian/Pacific Islander Hispanic White, non-Hispanic Race and ethnicity unknown MIXTURE of new and old race/ethnicity categories (all 14 categories will show on each screen): NEW categories: Notes for NEW categories: •Report Hispanic/Latino individuals of any race as Hispanic/Latino •Report race for non-Hispanic/Latino individuals only Hispanic/Latino American Indian or Alaska Native Asian Black or African American Native Hawaiian or Other Pacific Islander White Two or more races OLD categories: Black, non-Hispanic American Indian/Alaska Native Asian/Pacific Islander Hispanic White, non-Hispanic Categories used in BOTH New and Old: Nonresident alien Race and ethnicity unknown Institution: Naval Postgraduate School (119678) Part Selection Completion of Part B (Enrollment of Students by Age) is optional this year. Do you wish to complete Part B this year? If you select 'Yes', you will see Part B and be expected to complete the screens. If you select 'No', you will skip Part B. Yes, I will complete Part B No, I will not complete Part B You may use the space below to provide context for the data you've reported above. Institution: Naval Postgraduate School (119678) Fall Enrollment - CIPCODE Selection Indicate which of the following fields of study are offered by your institution. Students are to be reported by their major field of study for the categories listed below. Fields for which enrollment was reported for Fall 2006 have already been checked; please make sure all listed fields offered by your institution are checked. Undergraduate and graduate fields 13.0000 -- Education 14.0000 -- Engineering 26.0000 -- Biological and Biomedical Sciences 27.0000 -- Mathematics 40.0000 -- Physical Sciences 52.0000 -- Business, Management, Marketing, and Related Support Services None of the above You may use the space below to provide context for the data you've reported above. Curricula design makes it impossible to clearly delineate a field of study and/or to isolate the two fields of Engineering and Physical Science for obtaining an enrollment count. Students select a curriculum and then determine a degree program, which may include a mix: within the school of Engineering and Applied Sciences, the curricula "Undersea Warfare" offers 11 varying degrees (i.e. MS Physical Oceanography, MS Electrical Engineering, MS Engineering Acoustics, MS Applied Science-Physical Oceanography, MS Applied Science (Operations Research). Institution: Naval Postgraduate School (119678) Part A - Fall Enrollment by race/ethnicity and gender Enrollment as of the institution's official fall reporting date or as of October 15, 2008 CIPCODE: 99.0000 -- Summary Graduate students Students enrolled for credit Men Nonresident alien Total full-time Total part-time 217 0 79 13 4 3 51 21 74 18 Black, non-Hispanic American Indian/Alaska Native Asian/Pacific Islander Hispanic White, non-Hispanic 907 207 Race and ethnicity unknown 107 Total men Total men prior year Women Nonresident alien 321 1,439 1,549 583 715 7 0 18 3 1 0 13 7 5 3 91 38 Black, non-Hispanic American Indian/Alaska Native Asian/Pacific Islander Hispanic White, non-Hispanic Race and ethnicity unknown 21 Total women Total women prior year 80 156 146 131 159 Institution: Naval Postgraduate School (119678) Part A - Fall Enrollment by race/ethnicity and gender Enrollment as of the institution's official fall reporting date or as of October 15, 2008 CIPCODE: 27.0000 -- Mathematics and Statistics Graduate students Students enrolled for credit Men Nonresident alien Total full-time Total part-time 67 0 10 6 3 1 12 12 21 5 236 75 Black, non-Hispanic American Indian/Alaska Native Asian/Pacific Islander Hispanic White, non-Hispanic Race and ethnicity unknown 11 Total men Women Nonresident alien 110 360 209 4 0 4 0 1 0 4 3 0 1 31 10 Black, non-Hispanic American Indian/Alaska Native Asian/Pacific Islander Hispanic White, non-Hispanic Race and ethnicity unknown 0 Total women 18 44 32 Institution: Naval Postgraduate School (119678) Part A - Fall Enrollment by race/ethnicity and gender Enrollment as of the institution's official fall reporting date or as of October 15, 2008 CIPCODE: 52.0000 -- Business, Management, Marketing and Related Support Services Graduate students Students enrolled for credit Total full-time Men Total part-time Nonresident alien 38 0 22 6 0 1 15 6 7 10 153 100 Black, non-Hispanic American Indian/Alaska Native Asian/Pacific Islander Hispanic White, non-Hispanic Race and ethnicity unknown 7 139 Total men Women Nonresident alien 242 262 3 0 5 4 0 0 0 2 4 2 15 24 Black, non-Hispanic American Indian/Alaska Native Asian/Pacific Islander Hispanic White, non-Hispanic Race and ethnicity unknown 1 36 Total women 28 68 Institution: Naval Postgraduate School (119678) Part A - Fall Enrollment - Summary by race/ethnicity Fall enrollment totals CIPCODE: 99.0000 -- Summary Students enrolled for credit Total full-time students Men Nonresident alien Black, non-Hispanic American Indian/Alaska Native Asian/Pacific Islander Hispanic White, non-Hispanic Race and ethnicity unknown Total men Women Nonresident alien Black, non-Hispanic American Indian/Alaska Native Asian/Pacific Islander Hispanic White, non-Hispanic Race and ethnicity unknown Total women Grand Total Total part-time students Grand total, all students Prior year 217 79 4 51 74 907 107 1,439 0 13 3 21 18 207 321 583 217 92 7 72 92 1,114 428 2,022 257 113 7 92 103 1,124 568 2,264 7 18 1 13 5 91 21 156 1,595 0 3 0 7 3 38 80 131 714 7 21 1 20 8 129 101 287 2,309 9 21 2 22 10 113 128 305 Institution: Naval Postgraduate School (119678) Part A - Fall Enrollment - Summary by race/ethnicity Fall enrollment totals CIPCODE: 27.0000 -- Mathematics and Statistics Students enrolled for credit Men Nonresident alien Black, non-Hispanic American Indian/Alaska Native Asian/Pacific Islander Hispanic White, non-Hispanic Race and ethnicity unknown Total full-time students Total part-time students 67 10 3 12 21 236 11 Grand total, all students 0 6 1 12 5 75 110 67 16 4 24 26 311 121 Total men Women Nonresident alien Black, non-Hispanic American Indian/Alaska Native Asian/Pacific Islander Hispanic White, non-Hispanic Race and ethnicity unknown Total women Grand Total 360 209 569 4 4 1 4 0 31 0 44 404 0 0 0 3 1 10 18 32 241 4 4 1 7 1 41 18 76 645 Institution: Naval Postgraduate School (119678) Part A - Fall Enrollment - Summary by race/ethnicity Fall enrollment totals CIPCODE: 52.0000 -- Business, Management, Marketing and Related Support Services Students enrolled for credit Total full-time Total part-time students students Men Nonresident alien 38 Black, non-Hispanic 22 American Indian/Alaska Native 0 Asian/Pacific Islander 15 Hispanic 7 White, non-Hispanic 153 Race and ethnicity unknown 7 Total men 242 Women Nonresident alien 3 Black, non-Hispanic 5 American Indian/Alaska Native 0 Asian/Pacific Islander 0 Hispanic 4 White, non-Hispanic 15 Race and ethnicity unknown 1 Total women 28 Grand Total 270 Grand total, all students 0 6 1 6 10 100 139 262 38 28 1 21 17 253 146 504 0 4 0 2 2 24 36 68 330 3 9 0 2 6 39 37 96 600 Institution: Naval Postgraduate School (119678) Part F - Student-to-Faculty Ratio Please provide the following Fall 2008 data. These data will be used to calculate a student-to-faculty (i.e., student-toinstructional staff) ratio for display on College Navigator. (Note: Logic in this item is the same as item I-2 from the Common Data Set data collection.) Students, Fall 2008 1 Total full-time students 2 Of these, the number enrolled in graduate or professional programs such as medicine, law, veterinary, dentistry, social work, or public health, in which faculty teach virtually only graduate-level students 3 Total full-time students not in graduate or professional programs in which faculty teach virtually only graduate-level students (Line 1 - 2) 4 Total part-time students 5 Of these, the number enrolled in graduate or professional programs such as medicine, law, veterinary, dentistry, social work, or public health, in which faculty teach virtually only graduate-level students 6 Total part-time students not in graduate or professional programs in which faculty teach virtually only graduate-level students (Line 4 - 5) 7 Full-time equivalent of part-time students not in graduate or professional programs in which faculty teach virtually only graduate-level students (Line 6 * 1/3) 8 Total full-time equivalent students not in graduate or professional programs in which faculty teach virtually only graduate-level students (Line 3 + 7) Instructional staff, Fall 2008 9 Number of full-time instructional staff (as reported on EAP, full-time, non-medical, Line 1 Total + Line 2 Total) 10 Of these, the number teaching in graduate or professional programs such as law, veterinary, dentistry, social work, public health, or medicine, in which faculty teach virtually only graduate-level students 1,595 1,595 714 714 238 1,833 11 Total full-time instructional staff not teaching in graduate or professional programs in which faculty teach virtually only graduate-level students (Line 9 - 10) 12 Number of part-time instructional staff (as reported on EAP, part-time, non-medical, Line 1 Total + Line 2 Total [Note: this calculated Total does not include graduate assistants]) 13 Of these, the number teaching in graduate or professional programs such as law, veterinary, dentistry, social work, public health, or medicine, in which faculty teach virtually only graduate-level students 14 Total part-time instructional staff not teaching in graduate or professional programs in which faculty teach virtually only graduate-level students (Line 12 - 13) 15 Full-time equivalent of part-time instructional staff not teaching in graduate or professional programs in which faculty teach virtually only graduate-level students (Line 14 * 1/3) 16 Total full-time equivalent instructional staff not teaching in graduate or professional programs in which faculty teach virtually only graduate-level students (Line 11 + 15) 0 0 0 0 17 Student-to-faculty ratio 0 to 1 (Line 8/16) You may use the space below to provide context for the data you've reported above. These context notes will be posted on the College Navigator website.

