Water use efficiency: What is it? I. Stomatal Physiology
advertisement
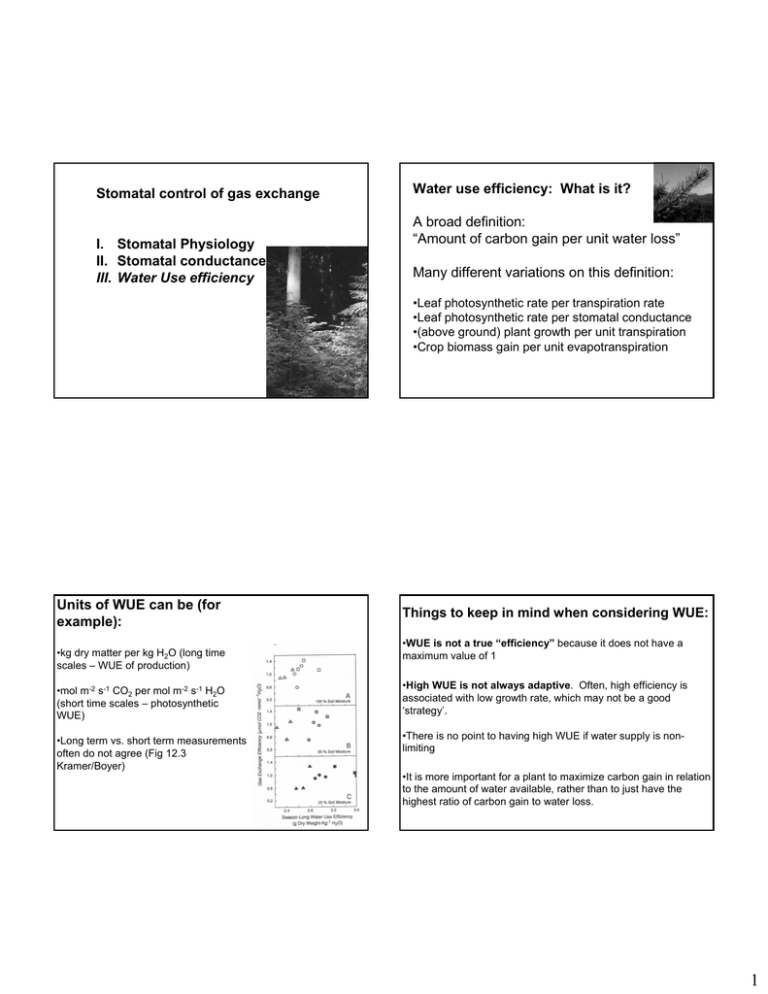
Stomatal control of gas exchange I. Stomatal Physiology II. Stomatal conductance III. Water Use efficiency Water use efficiency: What is it? A broad definition: “Amount of carbon gain per unit water loss” Many different variations on this definition: •Leaf photosynthetic rate per transpiration rate •Leaf photosynthetic rate per stomatal conductance •(above ground) plant growth per unit transpiration •Crop biomass gain per unit evapotranspiration Units of WUE can be (for example): •kg dry matter per kg H2O (long time scales – WUE of production) Things to keep in mind when considering WUE: •WUE is not a true “efficiency” because it does not have a maximum value of 1 •mol m-2 s-1 CO2 per mol m-2 s-1 H2O (short time scales – photosynthetic WUE) •High WUE is not always adaptive. Often, high efficiency is associated with low growth rate, which may not be a good ‘strategy’. •Long term vs. short term measurements often do not agree (Fig 12.3 Kramer/Boyer) •There is no point to having high WUE if water supply is nonlimiting •It is more important for a plant to maximize carbon gain in relation to the amount of water available, rather than to just have the highest ratio of carbon gain to water loss. 1 WUE differs substantially by plant form Functional Type WUE (mmol mol-1) CAM plants 4-20 C4 plants 4-12 Woody C3 2-11 Herbaceous C3 2-5 Hemiparasitic C3 0.3-2.5 Early studies found higher WUE in C4 compared to C3 crops before these metabolic pathways were even known! Nevertheless, there can be a surprising level of constancy in WUE within species at a given site Figure 12.1 Kramer/Boyer High atmospheric humidity generally promotes higher WUE, while high soil moisture may be associated with low WUE. Thus, the same plant or species, in the same location, can show seasonal variation in WUE e.g. Wheat in Russia ranged from 1.7 to 3.3 x 10⁻³ grams/gram from 1911-1917 (Maximov 1929) By the same token, plants of the same species can show variation in WUE from one environment to another A puzzle: crop WUE seemed to be insensitive to spatial variation in soil water among plots within a year, but show inter-annual differences (e.g. Maximov 1929) that seem to be associated with similar, but temporal variation in soil moisture. More work needed to understand soil nutrient levels, planting density, etc. 2 Using C isotopes to indicate WUE •Has advantages over gas exchange, because it integrates over the entire time period in which a tissue has grown – e.g. accounts for night respiration, etc. •99% atmospheric CO2 is 12CO2 1% is 13CO2 •More than 99% of plant tissue is made of 12C •Plants ‘discriminate’ against 13C: Why? Plants discriminate against 13C •12CO2 is lighter than 13CO2 and diffuses across stomates faster •Rubisco also ‘prefers’ 12CO2 over 13CO2 • The wider stomates are open, the more Rubisco can be ‘picky’. When stomata are relatively closed, Rubisco is less ‘picky’. •Thus, there is a link between the degree of discrimination against 13C and stomatal conductance Total discrimination Δ (%0) Since stomatal conductance controls both carbon gain and water loss, C isotope discrimination is directly correlated with WUE. Δ= a + (b-a)* Pi/Pa (Read Box 2 pp. 21-24) Where a = discrimination due to diffusion (4.4%0) b = discrimination due to Rubisco (~28 %0) 3 Linking Δ to WUE: WUE = A/E = gc(pa-pi)/gw(ei-ea) Independent measures of long term WUE and Δ confirm the linear relationship Fig. 10.5 Jones and LCP p. 55 fig. 30 = pa(1-pi/pa)/1.6(ei-ea) Or, equivalently, pi/pa = 1-WUE(ei-ea)/1.6Pa But Δ = 4.4 + 22.6*(pi/pa) Thus, Δ = 4.4 + 22.6*(1-WUE*(ei-ea)/1.6Pa) Δ is linearly (and negatively) related to WUE! Δ Can be from short lived materials (sugars) or long term materials (tissue). It can therefore be used for making inferences about WUE at a variety of time scales Δ Is affected by tree size – hydraulic control over Stomatal conductance? Pseudotsuga menziesii Wind River 19 Δ (‰) 18 17 16 15 0 10 20 30 40 50 60 70 80 Tree height (m) Thanks for slide Nate McDowell 4
