MODELING AN ICE-RICH LOBATE DEBRIS APRON IN DEUTERONILUS MENSAE. Head
advertisement

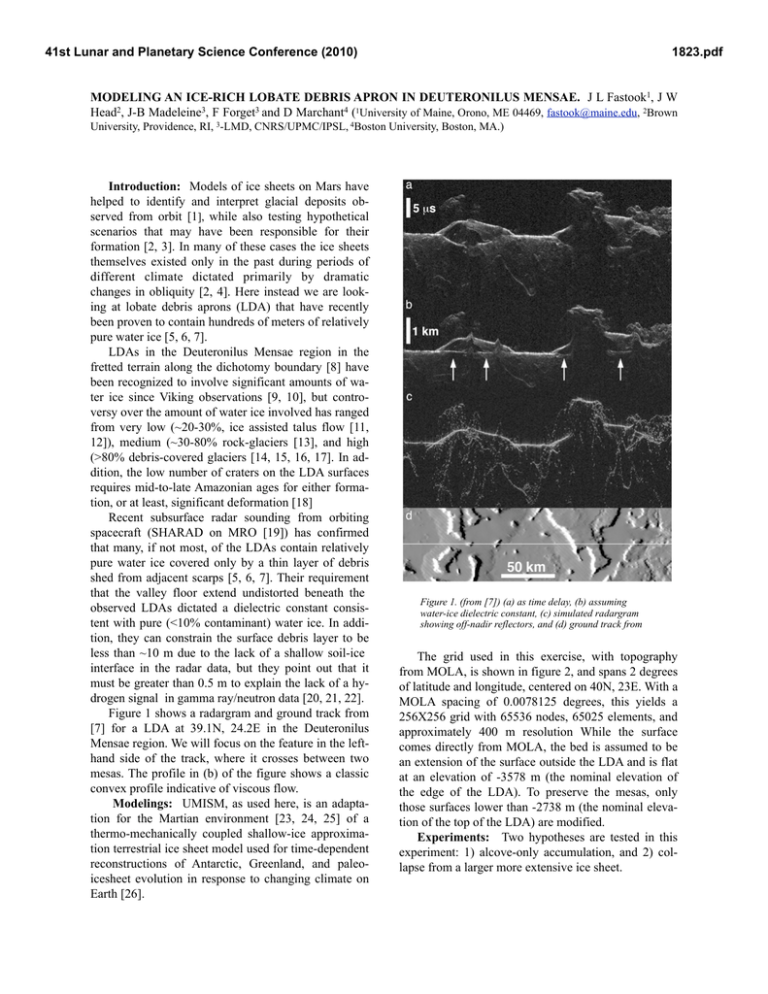
41st Lunar and Planetary Science Conference (2010) 1823.pdf MODELING AN ICE-RICH LOBATE DEBRIS APRON IN DEUTERONILUS MENSAE. J L Fastook1, J W Head2, J-B Madeleine3, F Forget3 and D Marchant4 (1University of Maine, Orono, ME 04469, fastook@maine.edu, 2Brown University, Providence, RI, 3-LMD, CNRS/UPMC/IPSL, 4Boston University, Boston, MA.) Introduction: Models of ice sheets on Mars have helped to identify and interpret glacial deposits observed from orbit [1], while also testing hypothetical scenarios that may have been responsible for their formation [2, 3]. In many of these cases the ice sheets themselves existed only in the past during periods of different climate dictated primarily by dramatic changes in obliquity [2, 4]. Here instead we are looking at lobate debris aprons (LDA) that have recently been proven to contain hundreds of meters of relatively pure water ice [5, 6, 7]. LDAs in the Deuteronilus Mensae region in the fretted terrain along the dichotomy boundary [8] have been recognized to involve significant amounts of water ice since Viking observations [9, 10], but controversy over the amount of water ice involved has ranged from very low (~20-30%, ice assisted talus flow [11, 12]), medium (~30-80% rock-glaciers [13], and high (>80% debris-covered glaciers [14, 15, 16, 17]. In addition, the low number of craters on the LDA surfaces requires mid-to-late Amazonian ages for either formation, or at least, significant deformation [18] Recent subsurface radar sounding from orbiting spacecraft (SHARAD on MRO [19]) has confirmed that many, if not most, of the LDAs contain relatively pure water ice covered only by a thin layer of debris shed from adjacent scarps [5, 6, 7]. Their requirement that the valley floor extend undistorted beneath the observed LDAs dictated a dielectric constant consistent with pure (<10% contaminant) water ice. In addition, they can constrain the surface debris layer to be less than ~10 m due to the lack of a shallow soil-ice interface in the radar data, but they point out that it must be greater than 0.5 m to explain the lack of a hydrogen signal in gamma ray/neutron data [20, 21, 22]. Figure 1 shows a radargram and ground track from [7] for a LDA at 39.1N, 24.2E in the Deuteronilus Mensae region. We will focus on the feature in the lefthand side of the track, where it crosses between two mesas. The profile in (b) of the figure shows a classic convex profile indicative of viscous flow. Modelings: UMISM, as used here, is an adaptation for the Martian environment [23, 24, 25] of a thermo-mechanically coupled shallow-ice approximation terrestrial ice sheet model used for time-dependent reconstructions of Antarctic, Greenland, and paleoicesheet evolution in response to changing climate on Earth [26]. Figure 1. (from [7]) (a) as time delay, (b) assuming water-ice dielectric constant, (c) simulated radargram showing off-nadir reflectors, and (d) ground track from The grid used in this exercise, with topography from MOLA, is shown in figure 2, and spans 2 degrees of latitude and longitude, centered on 40N, 23E. With a MOLA spacing of 0.0078125 degrees, this yields a 256X256 grid with 65536 nodes, 65025 elements, and approximately 400 m resolution While the surface comes directly from MOLA, the bed is assumed to be an extension of the surface outside the LDA and is flat at an elevation of -3578 m (the nominal elevation of the edge of the LDA). To preserve the mesas, only those surfaces lower than -2738 m (the nominal elevation of the top of the LDA) are modified. Experiments: Two hypotheses are tested in this experiment: 1) alcove-only accumulation, and 2) collapse from a larger more extensive ice sheet. 41st Lunar and Planetary Science Conference (2010) 1823.pdf 305-317. [4] Madeleine et al. (2009) Icarus 203, 390405. [5] Holt et al. (2008) LPS XXIX, Abstract #2441. [6] Plaut et al. (2008) LPS XXXIX, Abstract #2290. [7] Plaut et al. (2009) Geophys. Res. Lett. 36, L02203. [8] Sharp et al. (1973) J. Geophys. Res. 78, 4073-4083. [9] Carr and Schaber (1977) J. Geophys. Res. 82, 40394054. [10] Luchitta (1984) J. Geophys. Res., 89, B409– B418. [11] Squyres (1978) Icarus, 34, 600-613. [12] Squyres (1979) J. Geophys. Res. 84, 8087-8096. [13] Mangold et al. (2002) Planet. Space Sci. 50, 385401. [14] Colaprete and Jakosky (1998) J. Geophys. Res. 103, 5897-5909. [15] Head et al. (2005) Nature 434, 346-351. [16] Head et al. (2006a) Geophys. Res. Lett. 33, L08S03. [17] Head et al. (2006b) Earth Planet Sci. Lett. 241, doi:10.1016/j.epsl.2005.11.016. [18] Chuang and Crown (2005) Icarus, 179, 24– 42. [19] Seu et al. (2007) J. Geophys. Res., 112, E05S05. [20] Boynton et al. (2007) J. Geophys. Res., 112, E12S99. [21] Feldman et al. (2004) J. Geophys. Res., 109, E09006. [22] Mitrofanov et al. (2002) Science, 297, 78 – 81. [23] Fastook et al. (2004) LPS XXXV, Abstract #1352. [24] Fastook et al. (2005) LPS XXXVI, Abstract #1212. [25] Fastook et al. (2006) LPS XXXVII, Abstract #1794. [26] Fastook (1993) Computational Science and Engineering 1, 55--67. [27] Marchant and Head (2004) LPS XXXV, Abstract #1405. [28] Marchant and Head (2005) LPS XXXVI, Abstract #1421. [29] Marchant et al. (2007) USGS OFR-2007, 1-4. [30] Shean et al. (2007) Antarctic Science 4, 485496. [31] Fastook et al. (2008) LPS XXXIX, Abstract #1109. [32] Fastook et al. (2009) LPS XL, Abstract #1144. Figure 2: Surface and thickness of the modeled LDA. Approximate groundtrack of Figure 1 is shown by the black For the first case, for which the Earth analog is the Mullins Glacier in the Dry Valleys of Antarctica [27, 28, 29, 30], a small catchment at the base of the scarps is prescribed [31] with minimal ablation elsewhere. We begin with no LDA and observe the formation time and compare the modeled surface with the present. Figure 3 shows a sample of a possible velocity field where alcove accumulation is 2.5 mm/yr and ablation elsewhere is -0.15 mm/yr. For the second case, we assume a climate from a GCM run at an obliquity of 35 degrees [4, 32] and build a much more extensive ice sheet covering a broader region. As this ice sheet collapses, we compare remnants with the observed LDA. References: [1] Head and Marchant (2003) Geology 31(7), 641-644. [2] Forget et al. (2006) Science 5759, 368-371. [3] Fastook et al. (2008) Icarus 198, Figure 3: Velocity (mm/yr) for Alcove-accumulation case.

