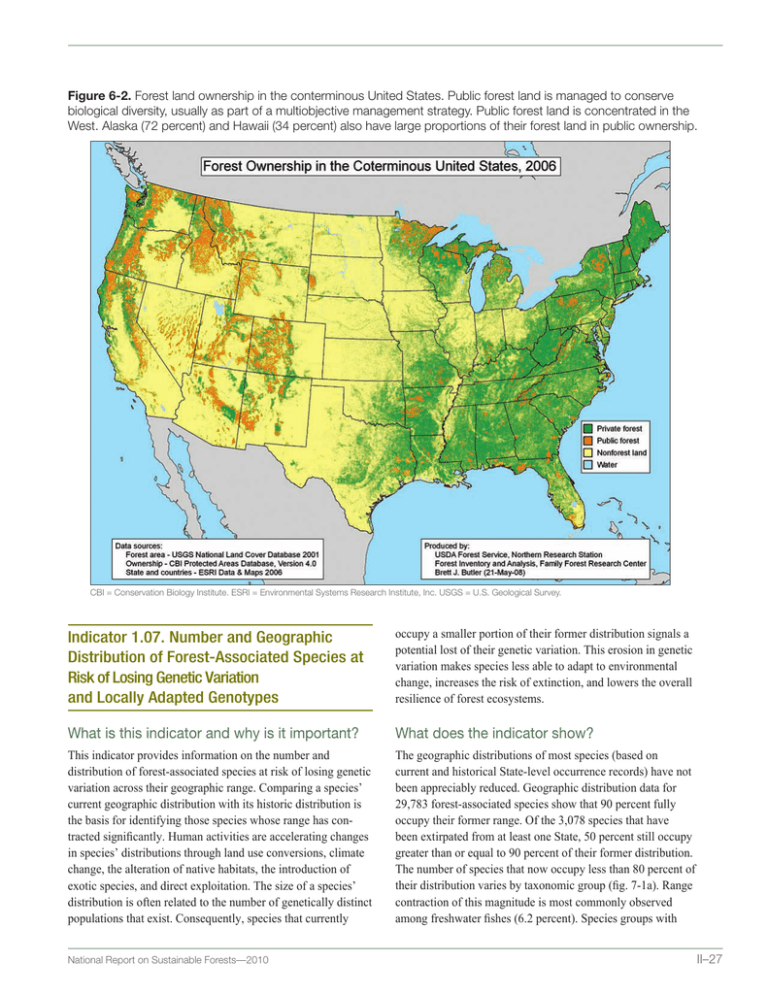
Figure 6-2.
advertisement

Figure 6-2. Forest land ownership in the conterminous United States. Public forest land is managed to conserve biological diversity, usually as part of a multiobjective management strategy. Public forest land is concentrated in the West. Alaska (72 percent) and Hawaii (34 percent) also have large proportions of their forest land in public ownership. CBI = Conservation Biology Institute. ESRI = Environmental Systems Research Institute, Inc. USGS = U.S. Geological Survey. Indicator 1.07. Number and Geographic Distribution of Forest-Associated Species at Risk of Losing Genetic Variation and Locally Adapted Genotypes occupy a smaller portion of their former distribution signals a potential lost of their genetic variation. This erosion in genetic variation makes species less able to adapt to environmental change, increases the risk of extinction, and lowers the overall resilience of forest ecosystems. What is this indicator and why is it important? What does the indicator show? This indicator provides information on the number and distribution of forest-associated species at risk of losing genetic variation across their geographic range. Comparing a species’ current geographic distribution with its historic distribution is the basis for identifying those species whose range has contracted significantly. Human activities are accelerating changes in species’ distributions through land use conversions, climate change, the alteration of native habitats, the introduction of exotic species, and direct exploitation. The size of a species’ distribution is often related to the number of genetically distinct populations that exist. Consequently, species that currently The geographic distributions of most species (based on current and historical State-level occurrence records) have not been appreciably reduced. Geographic distribution data for 29,783 forest-associated species show that 90 percent fully occupy their former range. Of the 3,078 species that have been extirpated from at least one State, 50 percent still occupy greater than or equal to 90 percent of their former distribution. The number of species that now occupy less than 80 percent of their distribution varies by taxonomic group (fig. 7-1a). Range contraction of this magnitude is most commonly observed among freshwater fishes (6.2 percent). Species groups with National Report on Sustainable Forests—2010 II–27 at least 5 percent of species occupying less than 80 percent of their former ranges include select invertebrates, birds, and mammals. Geographically, States that have lost the greatest number of species associated with forests are concentrated in the Mid-Atlantic Region and into New England (fig. 7-1b). What has changed since 2003? Comparisons of the percent of species occupying less than 80 percent of their former range with the 2003 report is restricted to terrestrial vertebrate taxa. Among these species groups, range contraction of this magnitude increased the most among forest-associated birds, followed by amphibians and reptiles (fig. 7-2a). The percent of mammals with range declines of this magnitude actually declined since the 2003 report. A broader accounting of species that inhabit forests has occurred because of new habitat affinity data. The number of forest-associated species that have been extirpated from States has increased noticeably in the Eastern United States (fig. 7-2b). The Mid-Atlantic, several New England States, and Missouri saw gains in excess of 75 species since the 2003 report. This gain in extirpated species is largely attributable to more comprehensive treatment of vascular plants and invertebrates that were not included in the 2003 analysis. Why can’t the entire indicator be reported at this time? Estimates of species’ geographic distributions are a basic need of conservation plans. Although historical records, species collections, and expert opinion are available to estimate the distribution of most vascular plant and vertebrate species, we lack much of these data for those species groups that collectively represent most of described species (e.g., many invertebrates, fungi). Even among vascular plants and vertebrates we lack the data needed to refine the coarse State-level analysis reported here to quantify species range changes across the landscape. In particular, reconstruction of former distributions is hampered by the absence of comprehensive historic records. Although efforts are under way to document species distributions, these compilations are often based on expert opinion that provides an estimate of the current range only. Because a species’ geographic distribution is dynamic, a statistically designed inventory that permits an objective and systematic assessment of range occupancy over time is needed to fully meet the intent of this indicator. Figure 7-1. (a) The percentage of vascular plants, vertebrates, and select invertebrates associated with forest habitats that now occupy less than 80 percent of their former geographic distribution (based on State-level occurrence data). (b) The number of forest-associated species (vascular plants, vertebrates [no freshwater fish], and select invertebrates) that have been extirpated within each State. (2009, data provided by NatureServe). (a) (b) 7 Species with significant range contraction (percent) 6 5 4 3 2 1 II–28 sh es ile s at er fi w Re pt Fr es h bi an s rd s ph i m am Bi Am als es at M br te ve r In Va s cu lar pl an t s 0 Number of species extirpated <=25 >25–50 >50–75 >75–100 >100 National Report on Sustainable Forests—2010 Figure 7-2. A comparison of the 2003 and 2010 reports for forest-associated terrestrial vertebrates on (a) the per­centage of species that now occupy less than 80 percent for their former geographic distribution (based on State-level occurrence data), and (b) the number of species (vascular plants, vertebrates [no freshwater fish], and select invertebrates) that have been extirpated within each State. (Actual reporting dates were 2002 and 2009.) (a) Species with significant range contraction (percent) 6 5 4 Amphibians Birds Mammals Reptiles 3 Indicator 1.08. Population Levels of Selected Representative Forest-Associated Species To Describe Genetic Diversity. What is this indicator and why is it important? This indicator uses population trends of selected bird and tree species as a surrogate measure of genetic diversity. Population decreases, especially associated with small populations, can lead to decreases in genetic diversity, and contribute to increased risk of extinction. Many forest-associated species rely on some particular forest structure, vegetation associations, or ecological processes. Monitoring population levels of such representative species will indicate the status of the associations of species associated with specialized conditions. Management use of this indicator will ensure forest health conditions are being monitored and may help avoid species extinction. What does the indicator show? 2 1 0 2003 report 2010 report (b) Between 1966 and 2006, about 27 percent of forest-associated bird species increased and 25 percent decreased; for nearly one-half the species no strong evidence existed for an increasing or decreasing trend. Most of 38 tree species or species groups analyzed showed increases in number of stems of greater than 50 percent for moderate to large diameter classes (greater than 12 inches in diameter) between 1970 and 2007 (fig. 8-1). State wildlife agency data indicate that populations of many big game species increased in the past 25 years, but forest-associated small game species showed mixed trends. Are there important regional differences? Number of species extirpated <5 5–25 >25–50 >50–75 >75 National Report on Sustainable Forests—2010 The South has the greatest proportion of physiographic regions with higher numbers of bird species with significantly decreasing trends compared to bird species with significantly increasing trends (fig. 8-2). For tree species, the Pacific Coast Region has a greater number of tree species or species groups showing declines in large diameter classes compared to other regions (fig. 8-3). What has changed since 2003? Most forest-associated bird species with significantly decreasing population trends between 1966 and 2003 also had decreasing trends between 1966 and 2006. Bird species associated with early successional and wetland habitats are among those with declining population trends; populations of some generalist bird species and some favored by burning have increased (fig. 8-4a). Most tree species showed relatively small changes in stem numbers since 2002, although a few species such as black walnut had increases greater than 15 percent and other species such as jack pine decreased by greater than 25 percent (fig. 8-4b). II–29


