High School Preparation HERE
advertisement

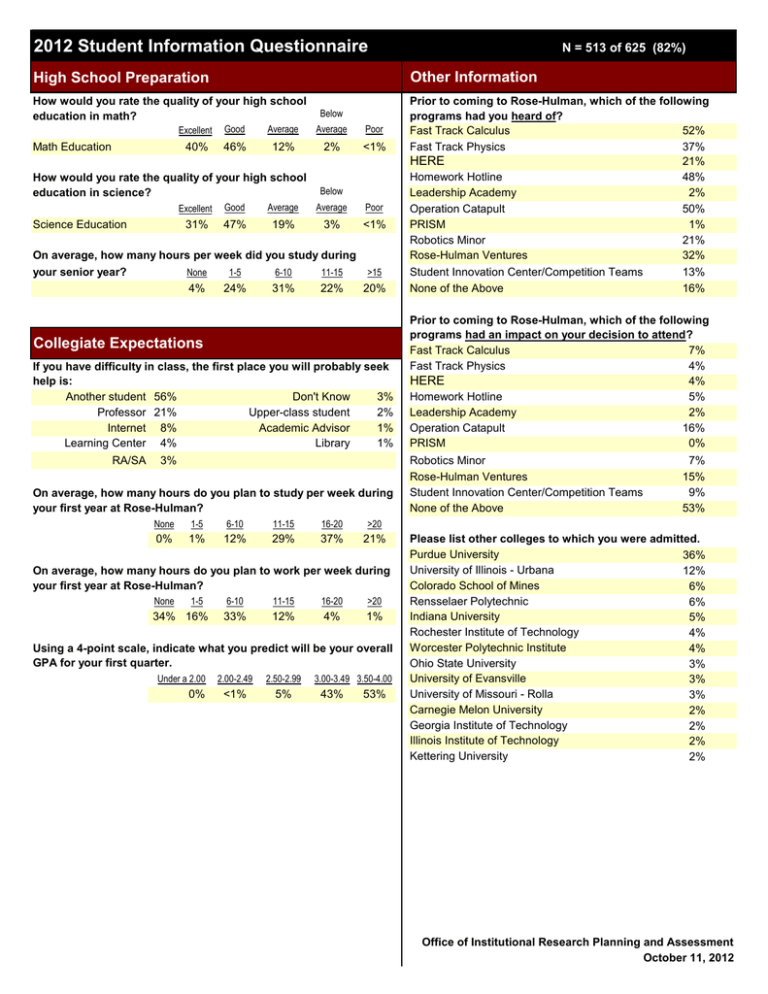
2012 Student Information Questionnaire Other Information High School Preparation How would you rate the quality of your high school education in math? Math Education Below Excellent Good Average Average Poor 40% 46% 12% 2% <1% How would you rate the quality of your high school education in science? Science Education Below Excellent Good Average Average Poor 31% 47% 19% 3% <1% On average, how many hours per week did you study during your senior year? None 1-5 6-10 11-15 >15 4% 24% 31% 22% 20% Collegiate Expectations If you have difficulty in class, the first place you will probably seek help is: Another student 56% Don't Know 3% Professor 21% Upper-class student 2% Internet 8% Academic Advisor 1% Learning Center 4% Library 1% RA/SA 3% On average, how many hours do you plan to study per week during your first year at Rose-Hulman? None 1-5 6-10 11-15 16-20 >20 0% 1% 12% 29% 37% 21% On average, how many hours do you plan to work per week during your first year at Rose-Hulman? None 1-5 34% 16% 6-10 11-15 16-20 >20 33% 12% 4% 1% Using a 4-point scale, indicate what you predict will be your overall GPA for your first quarter. Under a 2.00 0% N = 513 of 625 (82%) 2.00-2.49 2.50-2.99 <1% 5% 3.00-3.49 3.50-4.00 43% 53% Prior to coming to Rose-Hulman, which of the following programs had you heard of? Fast Track Calculus 52% Fast Track Physics 37% HERE 21% Homework Hotline 48% Leadership Academy 2% Operation Catapult 50% PRISM 1% Robotics Minor 21% Rose-Hulman Ventures 32% Student Innovation Center/Competition Teams 13% None of the Above 16% Prior to coming to Rose-Hulman, which of the following programs had an impact on your decision to attend? Fast Track Calculus 7% Fast Track Physics 4% HERE 4% Homework Hotline 5% Leadership Academy 2% Operation Catapult 16% PRISM 0% Robotics Minor Rose-Hulman Ventures Student Innovation Center/Competition Teams None of the Above 7% 15% 9% 53% Please list other colleges to which you were admitted. Purdue University 36% University of Illinois - Urbana 12% Colorado School of Mines 6% Rensselaer Polytechnic 6% Indiana University 5% Rochester Institute of Technology 4% Worcester Polytechnic Institute 4% Ohio State University 3% University of Evansville 3% University of Missouri - Rolla 3% Carnegie Melon University 2% Georgia Institute of Technology 2% Illinois Institute of Technology 2% Kettering University 2% Office of Institutional Research Planning and Assessment October 11, 2012

