MA212: Assignment #7
advertisement
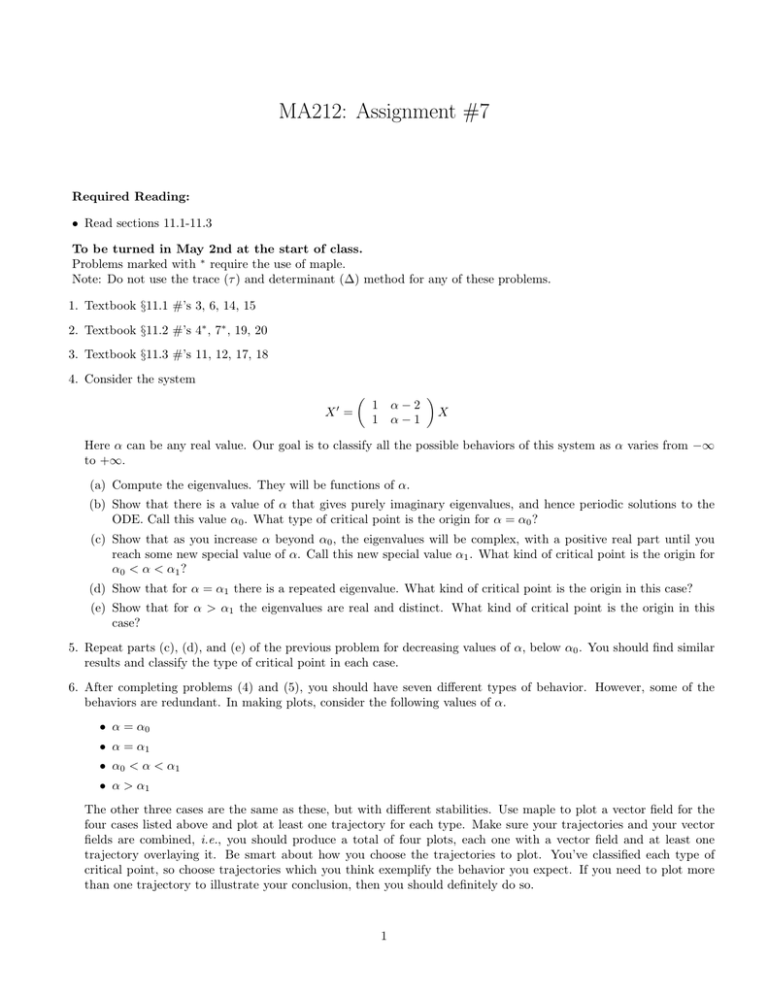
MA212: Assignment #7 Required Reading: • Read sections 11.1-11.3 To be turned in May 2nd at the start of class. Problems marked with ∗ require the use of maple. Note: Do not use the trace (τ ) and determinant (∆) method for any of these problems. 1. Textbook §11.1 #’s 3, 6, 14, 15 2. Textbook §11.2 #’s 4∗ , 7∗ , 19, 20 3. Textbook §11.3 #’s 11, 12, 17, 18 4. Consider the system 0 X = α−2 α−1 1 1 X Here α can be any real value. Our goal is to classify all the possible behaviors of this system as α varies from −∞ to +∞. (a) Compute the eigenvalues. They will be functions of α. (b) Show that there is a value of α that gives purely imaginary eigenvalues, and hence periodic solutions to the ODE. Call this value α0 . What type of critical point is the origin for α = α0 ? (c) Show that as you increase α beyond α0 , the eigenvalues will be complex, with a positive real part until you reach some new special value of α. Call this new special value α1 . What kind of critical point is the origin for α0 < α < α1 ? (d) Show that for α = α1 there is a repeated eigenvalue. What kind of critical point is the origin in this case? (e) Show that for α > α1 the eigenvalues are real and distinct. What kind of critical point is the origin in this case? 5. Repeat parts (c), (d), and (e) of the previous problem for decreasing values of α, below α0 . You should find similar results and classify the type of critical point in each case. 6. After completing problems (4) and (5), you should have seven different types of behavior. However, some of the behaviors are redundant. In making plots, consider the following values of α. • α = α0 • α = α1 • α0 < α < α1 • α > α1 The other three cases are the same as these, but with different stabilities. Use maple to plot a vector field for the four cases listed above and plot at least one trajectory for each type. Make sure your trajectories and your vector fields are combined, i.e., you should produce a total of four plots, each one with a vector field and at least one trajectory overlaying it. Be smart about how you choose the trajectories to plot. You’ve classified each type of critical point, so choose trajectories which you think exemplify the behavior you expect. If you need to plot more than one trajectory to illustrate your conclusion, then you should definitely do so. 1
