BY-CATCH OF RAYS
advertisement
Instituut voor L a n d b o u w ^ 'e n Visserijonderzoek
BY-CATCH OF RAYS
IN THE TRAWL FISHERY
FOR ATLANTIC SEABOB SH R IM P
XIPH O PENA EU S KRO YER I IN SURINAM E:
HOW EFFECTIVE ARE TEDs AND BRDs?
ILVO MEDEDELING nr 139
septem ber 2013
Tomas Willems
Jochen Depestele
Annelies De Backer
Kris Hostens
.
, , ,
. -
\VJ | Î| V\#
^
0
.
. .
-¿
f fS r Landbouw
U
e n V i ss e ri j
_
/
T|—
By-catch o f rays
in th e tra w l fishery
fo r A tla n tic seabob shrim p
X iphopenaeus kroyeri in Surinam e:
how e ffe c tiv e are TEDs and BRDs?
ILVO MEDEDELING nr 139
septem ber 2013
ISSN 1784-3197
W ettelijk Depot: D /2013/10.970/139
CONTENTS
ABSTRACT............................................................................................................................................................... 1
1.
INTRODUCTION............................................................................................................................................. 2
2.
MATERIALS AND METHODS........................................................................................................................ 3
3.
2.1
Study area.............................................................................................................................................. 3
2.2
Gear specifications............................................................................................................................... 4
2.3
Sea tr ia ls .................................................................................................................................................5
2.4
Data analysis.......................................................................................................................................... 5
RESULTS.......................................................................................................................................................... 6
3.1
Sea tr ia ls .................................................................................................................................................6
3.2
Count-based analysis............................................................................................................................8
3.3
Size-based analysis............................................................................................................................. 11
4.
DISCUSSION..................................................................................................................................................15
5.
ACKNOWLEDGEMENTS..............................................................................................................................16
6.
REFERENCES
16
ABSTRACT
Tropical shrim p traw lin g fisheries are generally known to capture a large am ount o f unwanted
organisms along w ith the targeted shrimp. To reduce this by-catch, the fishery fo r Atlantic seabob
shrim p Xiphopenaeus kroyeri in Suriname uses nets fitte d Turtle Excluder Devices (TEDs) and Bycatch Reduction Devices (BRDs). It is unclear, however, to w hat extend these selectivity measures,
designed to reduce capture o f marine tu rtles and small roundfish respectively, are reducing by-catch
o f rays. Due to th e ir life-history characteristics, rays (Batoidea; Chondrichthyes: Elasmobranchii) are
generally vulnerable to overexploitation and several endangered species are known to occur in
Surinamese waters. The objective o f this study th e re fo re is to assess th e effect o f the selectivity
devices currently in place (TEDs and BRDs) on ray by-catch in th e X. kroyeri traw ling fishery. Hereto,
sixty-five sim ultaneous catch-comparison hauls were conducted, com paring ray by-catch in traw ls
fitte d w ith (test-net) and w ith o u t (control-net) TEDs and BRDs.
Five d iffe re n t ray species occurred in th e by-catch, Gymnura m icrura and Dasyatis g u tta ta being the
dom inant species. Overall, catch rate o f rays was reduced by 36% in th e test-net. M oreover, rays th a t
did end up in th e test-net codend w ere on average 21% smaller than those in the control-net. This
confirm s th e presum ption th a t rays escape through TEDs rather than BRDs, smaller individuals being
able to pass through the TED, but larger ones being guided to the escape opening at th e bottom o f
th e net. TEDs were m ost efficient in excluding Dasyatis geijskesi, the largest ray species. By-catch of
D. g u tta ta was reduced as w ell, but exclusion was highly dependent on size.
A similar, but less
pronounced relationship between size and exclusion rate was observed fo r G. m icrura. Nevertheless,
large individuals o f both species w ere relatively rare, the bulk of the ray by-catch being made up by
small sized (< 40 cm body w idth ) individuals o f G. m icrura and D. g u tta ta , com plem ented w ith
Urotrygon m icrophthalm um , a small-sized species. Although TEDs and BRDs seem efficient in
reducing by-catch o f large rays, they seem inappropriate to protect small-sized individuals, which are
m ore abundant in th e population. W e th erefore suggest th a t fu rth e r by-catch related efforts in this
fishery are concentrated on reducing th e incidental capture o f small-sized rays.
1
1. INTRODUCTION
In recent years, there has been increasing concern on th e capture of chondrichthyans
(cartilaginous fish including rays and sharks) in marine fisheries. In contrast to teleost fish,
these animals are generally slow growing and long living, w ith late attainm ent o f sexual
m aturity, low fecundity and low natural m ortality. This K-selected life-history makes
chondrichthyans particularly vulnerable to over-exploitation (Stevens et al., 2000). Moreover,
rays and sharks are often o f low economic value to fisheries targeting teleost fishes or
invertebrates and hence discarded as unwanted by-catch. This m o rta lity m ostly remains
unreported, resulting in deficient inform ation on th e populations and occurrence o f
chondrichthyans w orldw id e (Stevens et al., 2000; Bonfil, 1994).
In the fishery fo r Atlantic seabob shrimp Xiphopenaeus kroyeri (Heller, 1862) o ff Suriname,
concerns have been raised on the by-catch o f chondrichthyan fish. Like most wild-caught
tropical shrimp, X. kroyeri is harvested w ith demersal fine-m eshed tra w l nets fished from
outrigger traw lers. The fishery started in 1996 and the fle e t now consists o f about 20 vessels
th a t operate 15 to 35 km offshore in Surinamese waters (FAO Statistical area 31). The vessels
are allowed to fish only in a restricted area delim ited by th e 10 and 15 fathom isobaths (18 to
27 meters) and land ca. 10.000 tons of X. kroyeri per annum. To reduce unwanted by-catch,
the traw ls are obligatory equipped w ith Turtle Excluder Devices (TEDs) and By-catch
Reduction Devices (BRDs, type square-mesh-window). BRDs
have indeed proven to reduce
the by-catch o f small fishes in this fishery (Polet H. & et al,
2010), w hile TEDs seem highly
e fficient in reducing by-catch o f marine tu rtle s wherever they are applied (e.g. Brewer et al.,
2006; Cox et al., 2007). M oreover, TEDs could theoretically exclude any organism larger th a t
the spacing between th e vertical bars. This seems relevant especially fo r rays (Batoidea,
Chondrichthyes: Elasmobranchii), which to due to th e ir large size and flattened body shape
are expected to escape through TEDs, as has been observed in other fisheries (Brewer et al.,
2006; Sala et al., 2011; Stobutzki et al., 2002). In the coastal waters of Suriname, different
species o f rays occur, some o f them being globally endangered (red-listed DD or NT by IUCN)
w hile th e ir distribution in Suriname appears to overlap w ith the zone dedicated fo r the X.
kroyeri tra w lin g fishery (W illems T., unpublished data). As a result, this fishery can pose a
th re a t to ray populations in th e area and it is clearly desirable to avoid th e ir capture.
Therefore, the aim o f this study is to address:
(1) w h eth er rays occur in the by-catch or are rather excluded from the traw ls;
(2) w h eth er exclusion is related to species identity and body size.
As such, th e current research assesses th e effectiveness o f the net-adaptations currently in
place (TED and BRD) in avoiding ray by-catch in the Suriname X. kroyeri traw ling fishery.
2
2. MATERIALSAND METHODS
2.1 Study area
The study was conducted on th e continental shelf o ff Suriname, inside the zone designated
fo r X. kroyeri traw lin g fisheries. The area was characterised by substrates o f mud to sandy
mud and depths o f 20 to 25m, bordered 6.169°N to 6.249°N, and 55.388°W to 55.841°W (Fig.
1). This area is frequented year-round by th e X. kroyeri traw ling fle e t (Steven Haii, pers.
comm.) and was th erefore considered a suitable study area.
N
0 12.5 25
50
■ ■ ■ --------- ^
75
100
125
Ki l ometers
A
Legend
R estricted area fo r X. kroyeri traw l fisheries
Figure 1. Study area
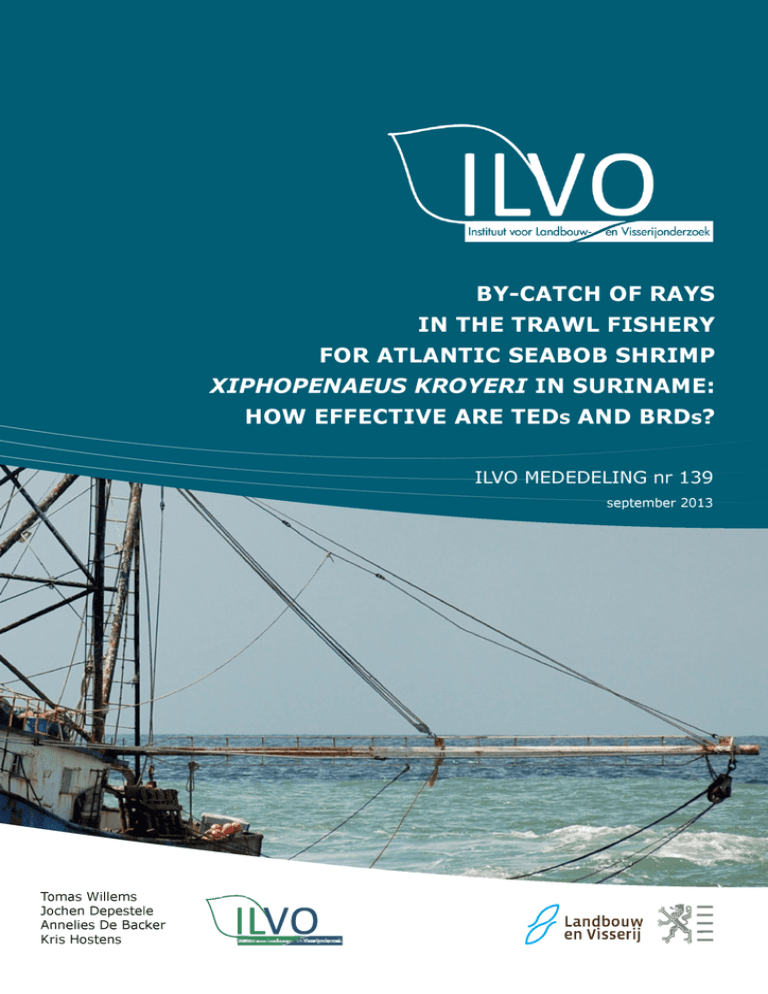
Figure 2. An ou trigger tra w le r in th e Suriname X. kroyeri
Figure 3. Simultaneous catch-comparison hauls com paring th e
tra w lin g fle e t ©Tom as W illems/ILVO
test-net (r.) to th e con trol-n et (I.) ©Tom as W illems/ILVO
3
2.2 G ear specifications
Experimental hauls w ere done onboard FV Neptune 6, a typical 20-m, 425-hp 'Florida type'
commercial outrigger tra w le r used in th e Suriname X. kroyeri fishery (Fig.2). The vessel was
equipped fo r tw in -rig b ottom -traw ling, which involves dragging tw o steel-footed wooden
doors and a m id-traw l sledge at either side o f the vessel, each pair o f doors fitte d to tw o
separate nets w ith mesh sizes ranging fro m 57mm in th e body and wings, decreasing to
45mm in th e codend. The nets have a vertical opening o f ca. 2 m and a fo o t rope weighted
w ith short (0.2 m) pieces o f tickler chain. Florizontal spread between tw o doors is ca. 21 m.
Nets are equipped w ith Turtle Excluder Devices (TEDs) and By-catch Reduction Devices
(BRDs) in each o f the fo u r codends. The alum inum dow nward-excluding TED, positioned in an
angle o f approxim ately 45° just before th e codend, has a bar-spacing o f 100 mm, guiding
larger animals to an escape opening at th e underside o f the net. The BRD is a square-meshw in do w panel (11 x 11 meshes, 150 mm stretched mesh size) in th e upper side of the codend
(Fig- 4).
codend
Turtle Excluder Device (TED)
side (rotated)
Figure 4. (a) fesf-net codend fitte d w ith TED and BRD and (b) details o f th e TED ©Hans Hillewaert/ILVO
4
2.3 Sea trials
Sea trials w ere carried out, making simultaneous catch-comparison hauls between a 'norm al'
tra w l fitte d w ith TED and BRD in both codends (the test-net) and another w ith o u t TEDs and
BRDs but otherw ise com pletely sim ilar (the control-net) (Fig.3). Hauls w ere conducted on
eight sampling days, spread between February 2012 and April 2013 accounting fo r possible
tem poral variation in th e occurrence o f rays in th e study area. At th e start o f each sampling
day, the tra w l o f e ither po rt or starboard side was m odified to fish as control-net by
rem oving the TEDs and attaching codends w ith o u t BRDs. In this configuration, 7 to 10
consequent hauls w ere carried o u t per day, dragging the test-net alongside th e control-net at
a speed o f 2.5 to 3 knots. In contrast to typical 4 to 5 hours dragging tim e, hauls w ere lim ited
to a m aximum o f 2 hours to reduce the risk o f injury or m o rta lity o f vulnerable species (e.g.
sea turtles) in th e control-net. Apart from this tim e restriction, hauls were conducted under
commercial fishing circumstances. At th e end o f each haul, both nets w here brought up and
em ptied on deck, assuring separation between catches o f test- and control-net. Rays were
manually sorted out, and all individuals identified to species and measured (maximum body
w id th ) to the nearest centim etre.
2 .4 D ata analysis
Analysis o f count data
Ray catches w ere recalculated to catch rate (individuals h"1). For each ray species, differences
in mean catch rate between test- and control-net were analyzed using param etric paired ttests. To assess differences in mean body size between the tw o nets, M ann-W hitney U test
w ere carried out on size data, as assumptions were not m et to perform Student's t-test.
Analyses w ere carried out using Statistica (StatSoft). Ray com m unities caught in both nets
w ere compared using an ANOSIM analysis in PRIMER-E (Clarke & Gorley R.N., 2006).
Analysis o f size data
The p roportion c()(S) o f rays (a certain ray species) retained by th e test-net at body size S can
be expressed fo r each size and each haul as:
4>(S) — Ns.test/( l^ls.te s t
where Ns,test and
N s,contro/
I^S.c o n tro l )
are num ber o f rays at size S (body w idth) measured fo r the test-net
(w ith TEDs and BRDs) and the control-net (w ith o u t TEDs and BRDs) respectively. A value o f cj)
= 0.5 indicates th a t there are no differences in catch in numbers between the tw o nets at size
S.
The catch at size proportion c()(S) fo r rays from the tw o nets was analyzed using the
Generalized Linear Mixed M odel (GLMM) w ith
binom ial distribution and size (S) as
explanatory variable(s) and cj) as the response variable, according to the m ethod described by
Holst & Revill (2009). The catch comparison curves vary among hauls, potentially in a lengthspecific manner. In addition to the fixed effects, inter-haul correlation was incorporated into
the models by th e inclusion o f random intercept an d /o r slope effects. The concept o f random
effects is well known fo r generalized linear mixed models in fisheries science (Venables &
Dichmont, 2004). The random effect structure was selected using the Akaike inform ation
5
criterion (AlC) and restricted m aximum likelihood (Zuur e t al., 2009: 122) . The random effect
polynom ial regression GLMM was used to fit catch comparison curves fo r th e expected
proportions of th e catch retained by th e test-net, after logit transform ation, as:
logit[ct)(S)] = ßo+ß 1S + ß2S2
The preferred random effect model was used fo r model selection o f th e fixed effects
(constant, linear a n d /o r 2nd order) and was based on AlC as w ell. The analysis was perform ed
using R statistical environm ent.
3. RESULTS
3.1 Sea trials
Sixty-five successful catch-comparison hauls w ith an average duration o f l h l 6 " were carried
out (Table 1), catching a to ta l o f 3181 rays o f five d iffe re n t species: Smooth b u tte rfly ray
(Gymnura m icrura),
Longnose
stingray
(Dasyatis guttata),
Smalleyed
round
stingray
(Urotrygon m icrophthalm um ), Sharpsnout stingray (Dasyatis geijskesi) and Cownose ray
(Rhinoptera bonasus). Additional chondrichthyan fish species caught, but not considered in
the analyses, w ere Brazilian electric ray (Narcine brasiliensis), Smalleye Sm oothhound
(Mustelus higm ani) and Chola guitarfish (Rhinobatos percellens). No sea tu rtle s w ere caught.
Figure 5. Three
large-bodied
ray species
caught during th e study: (a) Dasyatis gu ttata ,
(b) Dasyatis geijskesi, (c) Gymnura m icrura ©
Tomas W illems/ILVO, Hans Hillewaert/ILVO
6
Table 1 Summary of haul data
Haul
Date
Shooting
Hauling
Duration
tim e
tim e
(h:m in)
Postion shot
Position hauled
1
21/02/2012
7:46
8:50
1 04
6.206
°N
55.806
°W
6.192
°N
55.762
°W
2
21/02/2012
9:10
10:05
0 55
6.190
°N
55.758
°W
6.196
°N
55.715
°W
3
4
21/02/2012
21/02/2012
10:15
11:40
11:25
12:51
1 10
1 11
6.193
6.187
°N
°N
55.711
55.668
°W
°W
6.192
6.178
°N
°N
55.664
55.723
°W
°W
5
21/02/2012
13:06
14:28
1 22
6.174
°N
55.733
°W
6.174
°N
55.710
°W
6
7
21/02/2012
21/02/2012
14:45
16:10
15:55
17:20
1 10
1 10
6.174
6.175
°N
°N
55.724
55.699
°W
°W
6.177
6.173
°N
°N
55.714
55.726
°W
°W
8
21/02/2012
17:35
18:51
1 16
6.177
°N
55.718
°W
6.175
°N
55.742
°W
9
21/02/2012
19:10
20:30
1 20
6.174
°N
55.747
°W
6.171
°N
55.699
°W
10
11
21/02/2012
24/04/2012
20:50
7:34
22:30
8:43
1 40
1 09
6.177
6.189
°N
°N
55.701
55.841
°W
°W
6.180
6.181
°N
°N
55.689
55.791
°W
°W
12
24/04/2012
9:12
10:23
1 11
6.182
°N
55.782
°W
6.181
°N
55.806
°W
13
14
24/04/2012
24/04/2012
10:43
12:25
11:58
13:32
1 15
1 07
6.186
6.174
°N
°N
55.795
55.807
°W
°W
6.178
6.181
°N
°N
55.798
55.787
°W
°W
15
24/04/2012
15:30
16:54
1 24
6.181
°N
55.813
°W
6.183
°N
55.796
°W
16
17
24/04/2012
24/04/2012
17:07
19:02
18:41
20:00
1 34
0 58
6.179
6.180
°N
°N
55.800
55.815
°W
°W
6.182
6.183
°N
°N
55.813
55.822
°W
°W
18
24/04/2012
20:45
22:31
1 46
6.180
°N
55.817
°W
6.186
°N
55.822
°W
19
20
28/05/2012
29/05/2012
22:22
4:00
23:58
6:00
1 36
2 00
6.210
6.213
°N
°N
55.730
55.663
°W
°W
6.213
6.207
°N
°N
55.669
55.661
°W
°W
21
29/05/2012
6:23
7:53
1 30
6.210
°N
55.668
°W
6.207
°N
55.678
°W
22
23
29/05/2012
29/05/2012
8:05
9:55
9:42
11:40
1 37
1 45
6.208
6.205
°N
°N
55.695
55.681
°W
°W
6.201
6.206
°N
°N
55.675
55.683
°W
°W
24
29/05/2012
11:53
13:44
1 51
6.212
°N
55.679
°W
6.205
°N
55.677
°W
25
29/05/2012
13:55
15:53
1 58
6.203
°N
55.671
°W
6.202
°N
55.664
°W
26
27
25/07/2012
25/07/2012
5:00
6:50
6:27
8:30
1 27
1 40
6.213
6.206
°N
°N
55.716
55.641
°W
°W
6.208
6.182
°N
°N
55.659
55.718
°W
°W
28
25/07/2012
8:47
10:33
1 46
6.183
°N
55.736
°N
55.735
25/07/2012
25/07/2012
10:48
12:50
12:27
14:25
1 39
1 35
6.181
6.177
°N
°N
55.726
55.770
6.179
6.173
°N
°N
55.750
55.779
31
25/07/2012
14:40
16:26
1 46
6.169
°N
55.792
6.174
°N
55.784
32
33
25/07/2012
25/07/2012
16:48
18:40
18:14
19:51
1 26
1 11
6.171
6.171
°N
°N
55.777
55.775
6.173
6.173
°N
°N
55.784
55.753
34
3/1 0/20 12
5:45
6:55
1 10
6.202
°N
55.720
6.203
°N
55.739
35
36
3/1 0/20 12
3/1 0/20 12
7:15
8:38
8:20
9:55
1 05
1 17
6.211
6.203
°N
°N
55.732
55.749
6.198
6.199
°N
°N
55.735
55.748
37
3/1 0/20 12
10:10
11:30
1 20
6.199
°N
55.743
6.208
°N
55.732
38
3/1 0/20 12
11:50
13:05
1 15
6.198
°N
55.735
6.191
°N
55.735
39
40
3/1 0/20 12
3/1 0/20 12
13:19
14:50
14:35
16:00
1 16
1 10
6.200
6.199
°N
°N
55.739
55.738
6.199
6.193
°N
°N
55.730
55.747
41
3/1 0/20 12
16:20
17:40
1 20
6.191
°N
55.748
6.183
°N
55.683
42
43
1/11/2012
1/11/2012
5:55
7:15
6:55
8:20
1 00
1 05
6.182
6.187
°N
°N
55.715
55.675
6.189
6.193
°N
°N
55.672
55.733
44
1/11/2012
8:40
9:44
1 04
6.197
°N
55.738
6.199
°N
55.690
45
46
1/11/2012
1/11/2012
10:00
11:25
11:10
12:35
1 10
1 10
6.203
6.200
°N
°N
55.683
55.650
6.193
6.213
°N
°N
55.631
55.672
47
1/11/2012
12:55
13:58
1 03
6.207
°N
55.688
6.186
°N
55.663
48
49
1/11/2012
1/11/2012
14:15
15:35
15:20
16:50
1 05
1 15
6.187
6.183
°N
°N
55.660
55.611
6.185
6.187
°N
°N
55.615
55.558
50
2/0 2/20 13
7:40
8:44
1 04
6.221
°N
55.677
6.225
°N
55.733
51
52
2/0 2/20 13
2/0 2/20 13
9:00
10:15
10:04
11:20
1 04
1 05
6.214
6.219
°N
°N
55.735
55.691
6.219
6.225
°N
°N
55.694
55.739
53
2/0 2/20 13
11:35
12:40
1 05
6.227
°N
55.744
6.227
°N
55.704
54
2/0 2/20 13
12:55
14:05
1 10
6.223
°N
55.699
6.216
°N
55.754
55
56
2/0 2/20 13
2/0 2/20 13
14:20
15:40
15:25
16:50
1 05
1 10
6.213
6.217
°N
°N
55.753
55.714
6.213
6.220
°N
°N
55.712
55.774
57
2/0 2/20 13
17:05
18:10
1 05
6.220
°N
55.775
6.222
°N
55.733
58
59
14/03/2013
14/03/2013
6:30
7:45
7:30
8:45
1 00
1 00
6.223
6.222
°N
°N
55.682
55.644
6.224
6.213
°N
°N
55.642
55.697
60
14/03/2013
9:00
10:00
1 00
6.215
°N
55.689
6.225
°N
55.641
61
62
14/03/2013
14/03/2013
10:15
11:32
11:20
12:32
1 05
1 00
6.220
6.232
°N
°N
55.640
55.590
6.227
6.222
°N
°N
55.595
55.549
63
14/03/2013
12:47
13:50
1 03
6.224
°N
55.543
6.223
°N
55.496
64
65
14/03/2013
14/03/2013
14:05
15:30
15:10
16:35
1 05
1 05
6.228
6.249
°N
°N
55.490
55.438
°w
°w
°w
°w
°w
°w
°w
°w
°w
°w
°w
°w
°w
°w
°w
°w
°w
°w
°w
°w
°w
°w
°w
°w
°w
°w
°w
°w
°w
°w
°w
°w
°w
°w
°w
°w
°w
°w
6.181
29
30
6.235
6.233
°N
°N
55.438
55.388
°w
°w
°w
°w
°w
°w
°w
°w
°w
°w
°w
°w
°w
°w
°w
°w
°w
°w
°w
°w
°w
°w
°w
°w
°w
°w
°w
°w
°w
°w
°w
°w
°w
°w
°w
°w
°w
°w
7
3.2 Count-based analysis
Occurrence o f rays
Rays w ere found present year-round in the study area and w ere captured in every
experim ental haul, although catch rate differed considerably between sampling days (Fig. 6).
In April 2012, on average 45 rays were caught per hour in the control-net, w hile in May 2012
this was only 6.3 individuals h"1. This corresponds to a mean density o f 4.3 to 0.6 rays ha"1 in
th e study area.
Mean ray catch rate per campaign
60
50
£
40
10
° 3 10.
°2-0 i.u
H °3.
Figure 6. Mean (+SE) ray catch rate in th e con trol net fo r each sam pling day.
Test-net data w ere not considered as th e y may be biased due to differences
in escape rate between sam pling days.
Species composition
Looking at th e com position o f ray by-catch, Gymnura m icrura and Dasyatis g u tta ta were the
m ost com m on species, accounting respectively fo r 45% and 37.1% of all rays caught.
Urotrygon m icrophthalm um (11.1%), Dasyatis geijskesi (6.3%) and Rhinoptera bonasus (0.6%)
w ere less abundant.
A shift in ray by-catch com position occurred in th e test-net compared to th e control-net
(Fig.7). The ray com m unity caught in th e control-net appeared significantly d iffe re n t from the
test-net, although th e difference was very small (ANOSIM; global R=0.053; sign, level 0.1%).
Ray by-catch composition in test- versus control-net
I
c o n tro l-n e t
Dasyatis geijskesi
Dasyatis g u tta ta
I
G ym nura m icrura
R h inoptera bonasus
U ro try g o n m ic ro p h th a lm u m
100%
Figure 7. Composition o f ray by-catch in th e test-n e t com pared to th e co n tro l-net.
8
Catch rate comparison
Overall, the mean catch rate o f rays (all species) was significantly reduced by 36.1% in the
test-net (mean 15.3 indiv. h"1) compared to th e control-net (mean 23.9 indiv. h"1; pcO.OOl;
Table 2). Considerable and significant reduction in catch rates were observed fo r Dasyatis
geijskesi (76.6%), Dasyatis g u tta ta (40.2%) and Gymnura m icrura (32.1%; all pcO.OOl; Table
2; Fig. 8). Catch rate reductions in Rhinoptera bonasus and Urotrygon m icrophthalm um were
smaller and appeared not significant (Table 2; Fig. 8).
Mean ray catch rate per species in test- and control-net
14
^2
***
■
D asya tis geijskesi D asya tis g u tta ta
G ym nura
m ic ru ra
co n tro l-n e t
Rhinop te ra
Uro try go n
bonasus
m ic ro p h th a lm u m
Figure 8. Mean (+SE) catch rate o f all ray species in test and con trol nets. Significant differences in mean catch rate
are indicated w ith asterisks ( * * * ; paried f-test; pO .O O l).
9
Table 2 Catch rate (individuals h'1) of five ray species in test and control nets and results of paired t-test comparing th e mean catch rates.
Dasyatis geijskesi
Dasyatis g u tta ta
Gymnura m icrura
R hinoptera
bonasus
Urotrygon
m icrophthalm um
A ll rays
Haul
Control
Test
Control
Test
Control
Test
Control
Test
Control
Test
Control
Test
1
1.9
0.9
12.2
2.8
12.2
11.3
0
0
15.9
20.6
42.2
35.6
2
0
0
1.1
0
3.3
1.1
0
0
2.2
2.2
6.5
3.3
3
0
0
0
0.9
3.4
2.6
0
0
1.7
0.9
5.1
4.3
4
1.7
0
10.1
7.6
25.4
16.1
0
0
0.8
1.7
38.0
25.4
5
2.2
0.7
17.6
3.7
38.8
27.1
0
0
5.9
7.3
64.4
38.8
25.7
6
0
0
3.4
3.4
22.3
16.3
0
0
7.7
6.0
33.4
7
0.9
0.9
1.7
2.6
11.1
13.7
0
0
2.6
2.6
16.3
19.7
8
1.6
0.8
3.2
4.7
17.4
16.6
0
0
2.4
8.7
24.5
30.8
9
3.0
0.8
4.5
0.8
14.3
9.8
0
0
9.8
1.5
31.5
12.8
10
0.6
1.2
6.0
5.4
25.2
15.6
0
0
3.6
2.4
35.4
24.6
11
0.9
0.9
37.4
14.8
32.2
27.8
0
0
0
0
70.4
43.5
12
2.5
0
12.7
7.6
22.0
32.1
0
0
0
0
37.2
39.7
13
2.4
0
24.0
4.0
49.6
8.0
0
0
0
0
76.0
12.0
14
1.8
1.8
14.3
6.3
26.9
26.9
0
0
0
0
43.0
34.9
15
0
0
6.4
0.7
23.6
5.7
0.7
0
0
0
30.7
6.4
16
0.6
0
11.5
1.9
21.7
5.1
0
0
0
0
33.8
7.0
17
2.1
0
8.3
7.2
38.3
14.5
1.0
0
0
0
49.7
21.7
18
1.7
0
4.5
2.8
11.9
10.8
1.1
0.6
0
0
19.2
14.2
19
0
0
0
0
0.6
1.9
0
0.6
0
0
0.6
2.5
20
0
1.0
2.0
2.0
5.0
5.5
0.5
0
0.5
0
8.0
8.5
21
0
0
2.0
2.0
2.7
1.3
0
0
0
0
4.7
3.3
22
0
0
1.2
0
4.9
5.6
0.6
0
0
0
6.8
5.6
23
0
0
0.6
0.6
8.6
1.1
0
0.6
0
0
9.1
2.3
24
0.5
0
0.5
1.6
2.2
2.2
1.6
0.5
0.5
0
5.4
4.3
25
0
0.5
3.1
0.5
6.1
1.5
0.5
1.0
0
0
9.7
3.6
26
0
0
12.4
2.1
3.4
0
0
0
0
0
15.9
2.1
27
1.8
0
9.0
3.0
6.6
3.0
0
0
0
0
17.4
6.0
28
1.1
0
6.8
5.1
9.1
2.8
0
0
0
0
17.0
7.9
29
3.0
0
9.1
9.7
7.9
2.4
0
0
0
0
20
12.1
30
9.5
3.8
17.1
11.4
9.5
6.3
0
0
0
0
36.0
21.5
31
3.4
0.6
11.3
7.9
2.8
1.7
0
0
1.7
0
19.2
10.2
32
0
0
7.0
2.8
4.2
1.4
0
0
2.1
2.1
13.3
6.3
33
0.8
0
4.2
2.5
0.8
3.4
0
0
0.8
0
6.8
5.9
34
6.0
1.7
18.9
4.3
4.3
1.7
0
0
0
0
29.1
7.7
35
10.2
0
12.9
8.3
5.5
3.7
0
0
0
0
28.6
12.0
36
12.5
0
16.4
14.8
3.1
7.0
0
0
0
0
31.9
21.8
37
2.3
0
8.3
12.0
5.3
3.8
0
0
0
0
15.8
15.8
38
0.8
0
15.2
5.6
8.0
8.0
0
0
0
0
24.0
13.6
39
0.8
0
8.7
11.1
3.9
2.4
0
0
0
0
13.4
13.4
40
0
0
19.7
6.9
6.9
3.4
0
0
0
0.9
26.6
11.1
41
2.3
0
27.0
13.5
12.8
4.5
0
0
3.0
0.8
45.0
18.8
42
1.0
1.0
3.0
5.0
0
5.0
0
0
2.0
7.0
6.0
18.0
43
0.9
0
2.8
5.5
2.8
0.9
0
0
2.8
4.6
9.2
11.1
44
0
0
4.7
0.9
4.7
0.9
0
0
0.9
0
10.3
1.9
45
2.6
0
18.9
13.7
12.0
10.3
0
0
5.1
2.6
38.6
26.6
46
8.6
0
28.3
12.9
15.4
13.7
0
0
0.9
1.7
53.1
28.3
47
1.0
0
12.4
2.9
7.6
3.8
0
0
7.6
0
28.6
6.7
48
7.4
0.9
24.0
25.8
31.4
13.8
0
0
25.8
12.0
88.6
52.6
49
12.0
4.0
30.4
20
7.2
12.8
0
0
8.8
32.8
58.4
69.6
50
0
0
3.8
1.9
0.9
1.9
0
0
0
0
4.7
3.8
51
0
0
1.9
0.9
0.9
0
0
0
0
0
2.8
0.9
52
0.9
0
0.9
1.8
2.8
2.8
0
0
0
0
4.6
4.6
53
0
0
9.2
2.8
3.7
1.8
0
0
0
0
12.9
4.6
54
0
0.9
2.6
4.3
2.6
9.4
0
0
0
0
5.1
14.6
55
2.8
1.8
1.8
4.6
5.5
5.5
0.9
1.8
0
0.9
11.1
14.8
56
1.7
0
3.4
4.3
0
3.4
0
0
0
0
5.1
7.7
57
0.9
0
7.4
11.1
4.6
3.7
0
0
0
0
12.9
14.8
12.0
58
0
0
2.0
5.0
4.0
4.0
0
0
1.0
3.0
7.0
59
1.0
1.0
5.0
4.0
0
0
0
0
2.0
0
8.0
5.0
60
0
0
5.0
3.0
3.0
1.0
0
0
1.0
0
9.0
4.0
61
0.9
0
8.3
3.7
3.7
2.8
0
0
1.8
2.8
14.8
9.2
62
0
0
5.0
5.0
9.0
3.0
0
0
9.0
14.0
23.0
22.0
63
0
2.9
4.8
1.9
10.5
10.5
0
0
5.7
1.0
21.0
16.2
64
1.8
0
4.6
3.7
9.2
3.7
0
0
10.2
4.6
25.8
12.0
65
5.5
1.8
8.3
3.7
9.2
7.4
0
0
11.1
3.7
34.2
16.6
Mean
2.0
0.5
9.1
5.4
10.4
7.0
0.1
0.1
2.4
2.3
23.9
15.3
SE
Red. by
0.4
0.1
1.0
0.6
1.3
0.9
0
0
0.6
0.7
2.4
1.6
76.6%
40.2%
32.1%
26.7%
5.6%
36.1%
t-value
-4.58808
-5.12039
-3.61791
-0.79999
-0.25708
-5.55699
p- value
< 0.001
< 0.001
< 0.001
0.4267
0.79794
< 0.001
10
3.3 Size-based analysis
M ean size
The rays captured during the experim ent had an average body w id th o f 29.6 cm (+-0.3cm)
but size varied greatly, the largest individual measuring 116 cm and the smallest one only 3
cm. Although considerable overlap was present, the five ray species showed marked
differences in body size range (Fig. 9).
120
100
80
40
Figure 9. Box-and-whisker-plots showing m inim um , maximum, 0.25 percentile, 0.75 percentile and median
body w id th o f th e d iffe re n t ray species. For each species, left-hand boxes present con trol-net catches,
right-hand boxes present test-net catches.
Size in test- versus control-net
Comparing th e body w id th o f rays captured in both nets, a significant overall 20.6%reduction in mean body w idth was observed fo r rays caught in the test-net (mean 25.54 cm)
relative to th e control-net (mean
32.18 cm; pcO.OOl; Table 3). Looking at the individual
species, a significant size reduction in th e test-net catches was observed fo r D. geijskesi
(37.8%) and D. g u tta ta (22.7%).
11
Table 3 Analysis of mean body width variation between catches in control en test-net. Results of M ann-W hitney U Tests.
Control-net mean
Test-net mean
Difference in
body w id th (cm)
SE
n
body w id th (cm)
SE
n
mean body w idth
P
Dasyatis geijskesi
67.30
1.78
161
41.87
4.21
38
37.8%
<0.001
Dasyatis g u tta ta
29.05
0.55
741
22.46
0.37
440
22.7%
<0.001
Gymnura m icrura
32.36
0.45
858
30.57
0.49
572
5.5%
0.0595
Rhinoptera bonasus
35.45
1.71
11
36.88
1.69
8
-4.0%
0.8027
Urotrygon m icrophthalm um
12.68
0.31
181
12.47
0.24
171
1.6%
0.9945
All rays
32.18
0.42
1952
25.54
0.35
1229
20.6%
<0.001
Species
Body w idth and escape ra tio
The proportion o f rays caught in th e test-net relative to th e control net was defined as:
test-net catch / (test-net catch + control-net catch), and is a measure fo r escape from the net.
The relationship between body size and escape was explored using GLMM. The GLMM was
applied only to D. g u tta ta and G. m icrura, as insufficient data w ere available to make a
reliable analysis o f the three o th er species. For D. g u tta ta a model could be fitte d in th e sizerange between 20 and 72 cm body w id th using 3-cm-classes. The best fit appeared a secondorder model (Table 4; pcO.OOl), th a t shows a sharp reduction in catch rate between 20 and
40 cm. Rays larger than 40 cm body w id th nearly all escaped (Fig. 10b).
For G. m icrura a model was fitte d between 18 and 57 cm body w id th , using 3-cm-classes. The
best model here was linear (Table 4, p=0.00716), showing a steady but lim ited catch rate
reduction over the m odelled size-range (Fig. l ib ) .
Table 4. Coefficient values and significance (P-value) from generalized linear mixed modelling (GLMM) of the proportion (4>) of th e catch
excluded by the test-net in relation to body width (S), w here logit[4>(S)] = ß0+ ßiS + ß2S2. ß0 = intercept, ßi = length, ß2 = length2
Species
Parameter
Estimate
SE
P-value
Dasyatis g u tta ta
ßi
0.0700
0.0199
<0.001
ß2
-0.0035
0.0008
<0.001
ßi
-0.0145
0.0054
0.00716
Gymnura m icrura
12
20
40
60
100
80
Body w id th (cm)
(b)
o
c*
M.
d
20
30
50
60
70
Body w id th (cm)
Figure 10. Size distribution (a) and GLMM m odelling o f size (b) fo r Dasyatis gu ttata , (a) Pooled length-frequency distributions
(solid line: c o n tro l-net; do tted line: test-net) and th e observed proportion (hollow dots) o f th e to ta l catch caught in th e test-net;
(b) GLMM m odelled proportion o f th e to ta l catches caught in th e test-net. Interpretation o f (b): A value o f 0.5 (dashed line)
indicates an even split between th e tw o traw ls, whereas a value o f 0.2 indicates th a t 20% o f all rays at th a t body w id th w ere
caught in th e test-net and 80% w ere caught in th e c o n tro l-net.
13
■-Û-Ô-O
Body w id th (cm)
Body w id th (cm)
Figure 11. Size distribution (a) and GLMM m odelling o f size (b) fo r Gymnura m icrura, (a) Pooled length-frequency distributions
(solid line: c o n tro l-net; do tted line: test-net) and th e observed proportion (hollow dots) o f th e to ta l catch caught in th e test-net;
(b) GLMM m odelled proportion o f th e to ta l catches caught in th e test-net. Interpretation o f (b): A value o f 0.5 (dashed line)
indicates an even split between th e tw o traw ls, whereas a value o f 0.2 indicates th a t 20% o f all rays at th a t body w id th w ere
caught in th e test-net and 80% w ere caught in th e c o n tro l-net.
14
4. DISCUSSION
Rays occurred in th e study area at any tim e o f the year and were found in th e by-catch o f both
th e test-net and th e control-net in each haul conducted during this research. Although catch rate
varied considerably among th e d iffe re n t sampling days, this does not necessarily reflect tem poral
patterns in the occurrence o f rays, as th e study was not designed to assess ray densities. The
pattern in Fig. 6 could as w ell suggest variable spatial occurrence o f rays w ith in th e study area
because all hauls on a sampling day were conducted at a specific part o f th e study area, at short
distance from one another.
Ray by-catch was dom inated by tw o species, G. m icrura and D. guttata, the three o ther species
being fa r less abundant. Strangely, Dasyatis americana, a species th a t seems abundant at similar
depths in neighbouring French-Guyana (Guéguen F., 2000), was not observed. The absence of
H im antura schmardae, Aetobatus narinari and M anta birostris was less surprising, as these
species are m ore rare (Léopold, 2005).
Overall, a 36%-reduction in num ber of rays was observed in th e test-net compared to the
control-net. The rays caught in th e test-net were on average also 21% smaller than th e ones
occurring in the control-net. As such, th e test-net seemed to exclude larger-sized individuals,
suggesting th e observed by-catch reductions w ere the result o f escape through TEDs rather than
BRDs. BRDs allow small sized fish to escape the traw l, which w ould theoretically cause a relative
size-increase in the test-net instead o f the observed decrease. We th e re fo re conclude th a t the
BRD was not causing exclusion o f rays. M oreover, rays are bottom -dw elling fish and probably
have the tendency to stick to the bottom o f th e tra w l rather than swim m ing tow ards th e BRD,
which is located in th e upper part o f the codend.
Reduction in ray catch rate was most pronounced fo r D. geijskesi, th e test-net catching 77% less
individuals. Although this species appeared quite rare, it was generally large in size. Therefore, D.
geijskesi escaped through th e TED-escape opening in test-net at a high rate, only the smaller
individuals (mean body w id th 42 cm; Table 3) being able to pass between the bars of the TED and
end up in th e test-net codend.
By-catch rate o f D. g u tta ta was reduced by 40%. The mean body w idth, but especially th e size
range of individuals caught in the test-net was reduced compared to the control-net. Looking at
GLMM o u tp u t (Fig. 10b), increasing exclusion occurs fo r individuals from 20 cm body w id th and
more, rays larger than 40 cm escaping fo r nearly 100%. Although by-catch o f G. m icrura was
reduced by 32%, neither size range nor mean body w idth was m arkedly d iffe re n t in the test-net.
There was, however, a steady increase in exclusion rate w ith increasing size, as seen in the
GLMM o u tp u t (Fig. l i b ) . This model shows a very d iffe re n t exclusion-at-size than the effect
observed fo r D. gu tta ta . W hile at a body w id th of, say, 50 cm nearly all D. g u tta ta escape from
th e tra w l, still ca. 35% of th e G. m icrura catch is found in th e test-net. This probably relates to the
fa ct th a t th e fo rm e r species is rigid and heavily built compared to th e latter, increasing chances
fo r escape than passing between the bars o f a TED.
The observed increasing exclusion rate w ith increasing body size fo r D. g u tta ta and G. m icrura
confirm s th e escape o f larger rays through TEDs. However, fo r both species, smaller individuals
(less than 40 cm) made up th e m ajor share o f the by-catch (Fig. 10a, lia ) . They are not able to
15
escape fro m th e traw ls at high rates, which is also seen fo r U. m icrophthalm um , a small species
th a t showed no exclusion. Thus, although TEDs seem efficient in excluding larger rays, small rays
actually make up th e bulk o f the by-catch, being either small species (U. m icrophthalm um ) or
young individuals of o th er species.
A t present, no population estimates o f rays in the area are available. As such, the im pact o f the X.
kroyeri tra w ling fishery on rays remains unclear. In any case, rays occur quite abundantly where
this fishery takes place, and some o f the species are globally endangered. TEDs seem to provide
best protection fo r D. geijskesi, as m ainly relatively large individuals occurred which showed high
exclusion rates. This is good news, as th e species is endangered, listed 'Near Threatened' on the
IUCN Red List o f Threatened Species (IUCN, 2013). However, the traw ls as they are used now (i.e.
th e test-net), doesn't seem to be appropriate in protecting D. g u tta ta and G. m icrura (both 'Data
Deficient'; IUCN, 2013). M ainly smaller individuals o f both species seem to occur in the area,
which w ere unable to escape through TEDs. For th e same reason, by-catch U. m icrophthalm um
('Least concern'; IUCN, 2013) is not reduced by the use o f TEDs. Insufficient data were collected
to make any conclusions on R. bonasus ('Near threathened';IUCN, 2013).
In summary, this study shows th a t the selectivity devices currently in use mainly w ork fo r large­
bodied rays. Further e ffo rt could th e re fo r be directed tow ards avoiding th e capture o f sm all­
sized individuals. A firs t step in this direction w ould be to test alternative selectivity devices. So
called 'N ordm ore-grids' w ith fine bar spacing m ight be interesting in this respect, as they
successfully reduced by-catch in a Brazian X. kroyeri tra w l fishery (Silva et al., 2012).
5. ACKNOWLEDGEMENTS
We wish to thank everybody w ho has contributed to this study, and especially th e follow ing
persons: Captain Steve Haii and his crew from Neptune 6; Jude Jagroop and other management
staff o f Heiploeg Suriname; the fisheries observers fro m th e M inistry o f Agriculture, Livestock
and Fisheries (LVV) and Kenneth Wan Tong You from th e Adek University o f Suriname fo r th e ir
help onboard; Ralph Sanders and Chris Meskens from Heiploeg Group (NV M orubel) fo r the
in itia tio n and support o f this study and to the PhD o f Tomas W illem s in general.
Tomas W illem s acknowledges a PhD grant from the Vlaamse Universitaire Raad (VLIR-UOSVLADOC, nr 2011-06), entitle d
'Towards sustainable management o f the seabob fishery
(Xiphopenaeus kroyeri) in th e coastal zone o f Suriname'.
6. REFERENCES
Bonfil, R., 1994. Overview o f w orld elasmobranch fisheries. FAO Fisheries Technical Paper 341.
16
Brewer, D., Heales, D., M ilton, D., Dell, Q., Fry, G., Venables, B., Jones, P., 2006. The im pact o f
tu rtle excluder devices and bycatch reduction devices on diverse tropical marine com m unities
in Australia's northern prawn tra w l fishery. Fish Res. 81, 176-188.
Clarke, K.R., Gorley R.N., 2006. PRIMER v6: User M anual/Tutorial. PRIMER-E, Plymouth.
Cox, T.A., Lewison, R.L., Zydelis, R., Crowder, L.B., Safina, C., Read, A.J., 2007. Comparing
effectiveness o f experim ental and im plem ented bycatch reduction measures: The ideal and
the real. Conservation Biology 21, 1155-1164.
Guéguen F., 2000. D istribution et abondance des poissons démersaux et quelques organismes
benthiques marins du plateau continental (0-60m) de Guyane fancaise. C. R. Acad. Sei. Paris,
Sciences de la via/Life Sciences 323, 775-791.
Holst, R., Revil I, A., 2009. A simple statistical m ethod fo r catch comparison studies. Fish Res. 95,
254-259.
IUCN. 2013. The IUCN Red List o f Threatened Species. Version 2013.1. Downloaded on 13
September 2013.
Léopold, M., 2005. Poissons de m er de Guyane. Ifremer.
Polet H., et al, 2010. Evaluation o f Bycatch Reduction Device (BRD) in Surinam Seabob fishery
(Xiphopenaeus kroyeri). ILVO Instituut voor Landbouw- en Visserijonderzoek. Unpubl.
Sala, A., Lucchetti, A., A ffronte, M., 2011. Effects o f Turtle Excluder Devices on bycatch and
discard reduction in th e demersal fisheries o f M editerranean Sea. Aquatic Living Resources 24,
183-192.
Silva, C.N.S., Broadhurst, M.K., Dias, J.H., Cattani, A.P., Spach, H.L., 2012. The effects o f Nordm oregrid bar spacings on catches in a Brazilian artisanal shrimp fishery. Fish Res. 127, 188-193.
Stevens, J.D., Bonfil, R., Dulvy, N.K., W alker, P.A., 2000. The effects of fishing on sharks, rays, and
chimaeras (chondrichthyans), and th e im plications fo r marine ecosystems. Ices Journal o f
M arine Science 57, 476-494.
Stobutzki, I.C., M iller, M.J., Heales, D.S., Brewer, D.T., 2002. Sustainability o f elasmobranchs
caught as bycatch in a tropical prawn (shrimp) tra w l fishery. Fishery Bulletin 100, 800-821.
Venables, W.N., Dichmont, C.M., 2004. GLMs, GAMs and GLMMs: an overview of theory fo r
applications in fisheries research. Fish Res. 70, 319-337.
Zuur, A.F., leño, E.N., W alker, N.J., Saveliev, A.A., Smith, G., 2009. Mixed Effects Models and
Extensions in Ecology w ith R. Springer, New York.
17
Contact:
Tomas Willem s
In s titu u t voor Landbouw en Visserijonderzoek ILVO
Eenheid D ier
A nkerstraat 1
8400 Oostende
Tel. +32 (0)59 56 38 01
tom as.willem s@ ilvo.vlaanderen.be
Deze publicatie kan ook geraadpleegd worden op:
ww w.ilvo.vlaanderen.be/pers en media/ILVO mededelingen
Verm enigvuldiging of overname van gegevens toegestaan mits duidelijke bronverm elding.
Aansprakelijkheidsbeperking
Deze publicatie werd door ILVO m et de meeste zorg en nauwkeurigheid opgesteld. Er w ordt evenwel
geen enkele garantie gegeven om trent de juistheid of de volledigheid van de inform atie in deze
publicatie. De gebruiker van deze publicatie ziet af van elke klacht tegen ILVO of zijn am btenaren,
van welke aard ook, m et betrekking to t het gebruik van de via deze publicatie beschikbaar gestelde
inform atie.
In geen geval zal ILVO of zijn am btenaren aansprakelijk gesteld kunnen worden voor eventuele
nadelige gevolgen die voortvloeien uit het gebruik van de via deze publicatie beschikbaar gestelde
inform atie.
In s titu u t vo o r Landbouw - en V isse rijo n d e rzo e k
Burg. Van G ansberghelaan 96
9820 M erelbeke - België
T + 3 2 (0 )9 272 25 00
F + 3 2 (0 )9 272 25 01
ilv o @ ilvo .vla a n d e re n .b e
w w w .ilv o .v la a n d e re n .b e
nivo
0
Landbouw
en Visseri]
