Function Transformations
advertisement

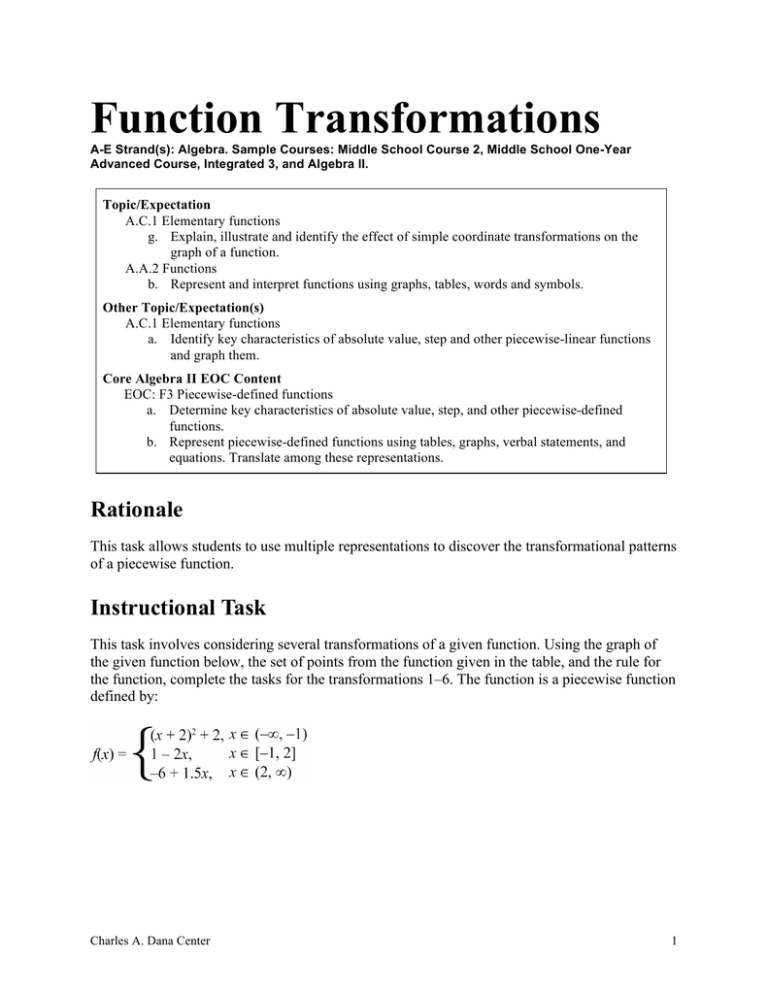
Function Transformations A-E Strand(s): Algebra. Sample Courses: Middle School Course 2, Middle School One-Year Advanced Course, Integrated 3, and Algebra II. Topic/Expectation A.C.1 Elementary functions g. Explain, illustrate and identify the effect of simple coordinate transformations on the graph of a function. A.A.2 Functions b. Represent and interpret functions using graphs, tables, words and symbols. Other Topic/Expectation(s) A.C.1 Elementary functions a. Identify key characteristics of absolute value, step and other piecewise-linear functions and graph them. Core Algebra II EOC Content EOC: F3 Piecewise-defined functions a. Determine key characteristics of absolute value, step, and other piecewise-defined functions. b. Represent piecewise-defined functions using tables, graphs, verbal statements, and equations. Translate among these representations. Rationale This task allows students to use multiple representations to discover the transformational patterns of a piecewise function. Instructional Task This task involves considering several transformations of a given function. Using the graph of the given function below, the set of points from the function given in the table, and the rule for the function, complete the tasks for the transformations 1–6. The function is a piecewise function defined by: Charles A. Dana Center 1 Function Transformations Graph 1 x -3 -2 -1 0 0.5 2 4 f(x) 3 2 3 1 0 -3 0 Complete a–d for each transformed function below. a. You are given a sketch of f(x). On the same grid sketch a graph of the transformed function for the specified transformation. b. Fill in the missing values in the second table that will produce (x, y) coordinates for points that lie on the transformed function. c. Write the function rule for your transformed function. d. Explain the transformation in words as it is seen in the graph, the table, and the function rule. Charles A. Dana Center 2 Function Transformations 1. Transformation: –f(x) a. Graph b. x -3 -2 -1 0 0.5 2 4 c. f(x) 3 2 3 1 0 -3 0 x -f(x) x f(-x) d. -f(x) = 2. Transformation: f(-x) a. Graph b. x -3 -2 -1 0 0.5 2 4 c. f(x) 3 2 3 1 0 -3 0 d. f(-x) = Charles A. Dana Center 3 Function Transformations 3. Transformation: f(x + 2) a. Graph b. x -3 -2 -1 0 0.5 2 4 c. f(x) 3 2 3 1 0 -3 0 x f(x+2) f(x) 3 2 3 1 0 -3 0 x f(x)+2 d. f(x + 2) = 4. Transformation: f(x) + 2 a. Graph b. x -3 -2 -1 0 0.5 2 4 c. d. f(x) + 2 = Charles A. Dana Center 4 Function Transformations 5. Transformation: 2f(x) a. Graph b. x -3 -2 -1 0 0.5 2 4 c. f(x) 3 2 3 1 0 -3 0 x 2f(x) x f(x) x 1 f(x) 2 -3 -2 -1 0 0.5 2 4 3 2 3 1 0 -3 0 d. 2f(x) = 6. Transformation: a. Graph c. 1 f(x) 2 b. d. 1 f(x) = 2 Charles A. Dana Center 5 Function Transformations Discussion/Further Questions/Extensions Teachers may use questions such as the following to guide and stretch student understanding. 1. What is the same and what is different about the graphs of the transformations in questions 1 and 2? Where do you see these similarities and differences in their function rule? Transformations 3 and 4? Transformations 5 and 6? 2. What is the same and what is different about the tables of the transformations in questions 1 and 2? Where do you see these similarities and differences in their function rules? Transformations 3 and 4? Transformations 5 and 6? 3. Predict the effect on the graph for the following transformation in words: -3f(x – 5) + 4. Verify your prediction. Teaching Note Teachers may want to make task cards for each student showing questions a–d on each card. The questions will then be visible as students examine each function transformation. Sample Solutions The answers for parts b and d below may vary. 1. Transformation: –f(x) a. Graph b. x -3 -2 -1 0 0.5 2 4 f(x) 3 2 3 1 0 -3 0 Charles A. Dana Center x -3 -2 -1 0 0.5 2 4 -f(x) -3 -2 -3 -1 0 3 0 6 Function Transformations c. d. The graph of –f(x) is a reflection of the original graph across the x-axis. In the table, the –f(x) values are the additive inverses of the f(x) values. In the function rule, each part of the rule is the additive inverse of the original function. 2. Transformation: f(-x) a. Graph b. x -3 -2 -1 0 0.5 2 4 f(x) 3 2 3 1 0 -3 0 x 3 2 1 0 -0.5 -2 -4 f(-x) 3 2 3 1 0 -3 0 c. [* NOTE: (-x + 2)2 + 2 is the same as (x – 2)2 +2] d. The graph of f(-x) is a reflection of the original graph across the y-axis. In the table, the x values used to find f(-x) are the additive inverses of the x values used for f(x). Each Charles A. Dana Center 7 Function Transformations component of the function rule is found by substituting -x for x in the original piecewise function rule. 3. Transformation: f(x + 2) a. Graph b. x -3 -2 -1 0 0.5 2 4 f(x) 3 2 3 1 0 -3 0 x -5 -4 -3 -2 -1.5 0 2 f(x+2) 3 2 3 1 0 -3 0 c. d. The graph of f(x + 2) is a translation of the original graph; it is shifted to the left 2 units. In the table, the x values used to find f(x + 2) are 2 less than the values used for x in the original f(x). Each component of the function rule is found by substituting x + 2 for x. Charles A. Dana Center 8 Function Transformations 4. Transformation: f(x) + 2 a. Graph b. x -3 -2 -1 0 0.5 2 4 f(x) 3 2 3 1 0 -3 0 x -3 -2 -1 0 0.5 2 4 f(x)+2 5 4 5 3 2 -1 2 c. d. The graph of f(x) + 2 is a translation of the original graph; it is shifted up 2 units. In the table, each f(x) + 2 value is 2 more than its corresponding f(x) value. Each component of the function rule is found by adding 2 to the original component. Charles A. Dana Center 9 Function Transformations 5. Transformation: 2f(x) a. Graph b. x -3 -2 -1 0 0.5 2 4 f(x) 3 2 3 1 0 -3 0 x -3 -2 -1 0 0.5 2 4 2f(x) 6 4 6 2 0 -6 0 c. d. The graph of 2f(x) appears to be a stretched version of the original graph; the y values are twice those of the corresponding y values for f(x). This can also be seen in the table. Each component of the piecewise function is found by multiplying the rule by 2. Charles A. Dana Center 10 Function Transformations 6. Transformation: 1 f(x) 2 a. Graph b. x f(x) x -3 -2 -1 0 0.5 2 4 3 2 3 1 0 -3 0 -3 -2 -1 0 0.5 2 4 1 f(x) 2 1.5 1 1.5 .5 0 -1.5 0 c. d. The graph of 1 f(x) appears to be a compressed version of the original graph; the y values are 2 1 those of the corresponding y values for f(x). You also see this in the table. Each 2 1 component of the piecewise function is found by multiplying the rule by . 2 Charles A. Dana Center 11


