Document 11667395
advertisement
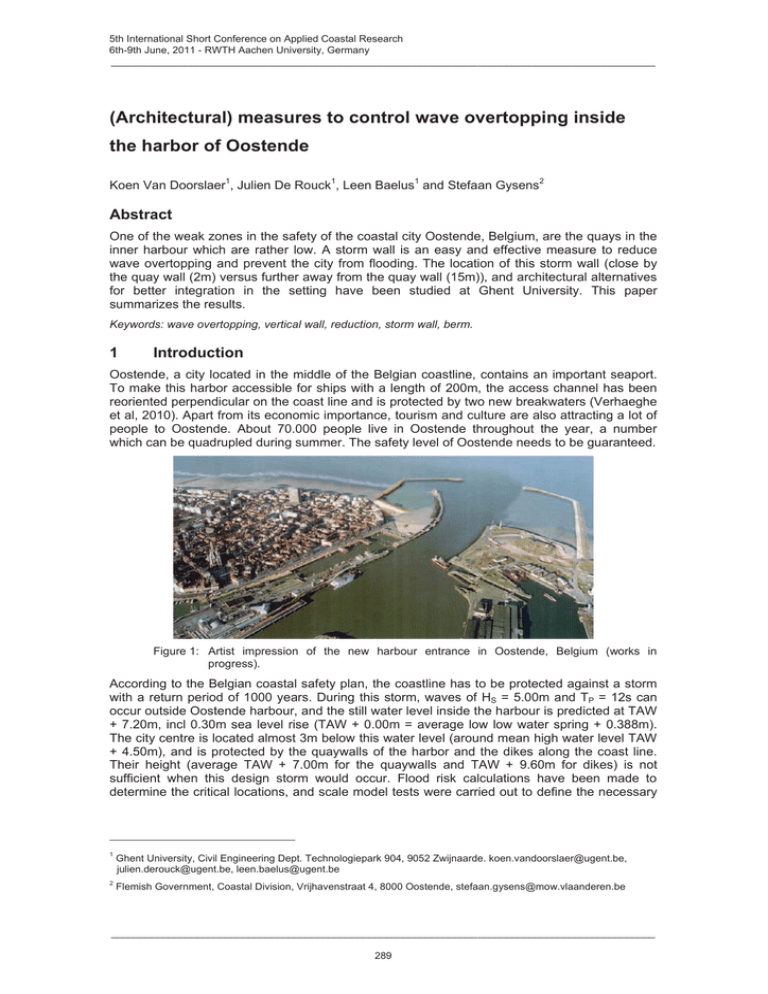
WK,QWHUQDWLRQDO6KRUW&RQIHUHQFHRQ$SSOLHG&RDVWDO5HVHDUFK WKWK-XQH5:7+$DFKHQ8QLYHUVLW\*HUPDQ\ BBBBBBBBBBBBBBBBBBBBBBBBBBBBBBBBBBBBBBBBBBBBBBBBBBBBBBBBBBBBBBBBBBBBBBBBBBBBBBBBBBBBBBBBBBBBBBB (Architectural) measures to control wave overtopping inside the harbor of Oostende Koen Van Doorslaer1, Julien De Rouck1, Leen Baelus1 and Stefaan Gysens2 Abstract One of the weak zones in the safety of the coastal city Oostende, Belgium, are the quays in the inner harbour which are rather low. A storm wall is an easy and effective measure to reduce wave overtopping and prevent the city from flooding. The location of this storm wall (close by the quay wall (2m) versus further away from the quay wall (15m)), and architectural alternatives for better integration in the setting have been studied at Ghent University. This paper summarizes the results. Keywords: wave overtopping, vertical wall, reduction, storm wall, berm. 1 Introduction Oostende, a city located in the middle of the Belgian coastline, contains an important seaport. To make this harbor accessible for ships with a length of 200m, the access channel has been reoriented perpendicular on the coast line and is protected by two new breakwaters (Verhaeghe et al, 2010). Apart from its economic importance, tourism and culture are also attracting a lot of people to Oostende. About 70.000 people live in Oostende throughout the year, a number which can be quadrupled during summer. The safety level of Oostende needs to be guaranteed. Figure 1: Artist impression of the new harbour entrance in Oostende, Belgium (works in progress). According to the Belgian coastal safety plan, the coastline has to be protected against a storm with a return period of 1000 years. During this storm, waves of HS = 5.00m and TP = 12s can occur outside Oostende harbour, and the still water level inside the harbour is predicted at TAW + 7.20m, incl 0.30m sea level rise (TAW + 0.00m = average low low water spring + 0.388m). The city centre is located almost 3m below this water level (around mean high water level TAW + 4.50m), and is protected by the quaywalls of the harbor and the dikes along the coast line. Their height (average TAW + 7.00m for the quaywalls and TAW + 9.60m for dikes) is not sufficient when this design storm would occur. Flood risk calculations have been made to determine the critical locations, and scale model tests were carried out to define the necessary 1 Ghent University, Civil Engineering Dept. Technologiepark 904, 9052 Zwijnaarde. koen.vandoorslaer@ugent.be, julien.derouck@ugent.be, leen.baelus@ugent.be 2 Flemish Government, Coastal Division, Vrijhavenstraat 4, 8000 Oostende, stefaan.gysens@mow.vlaanderen.be BBBBBBBBBBBBBBBBBBBBBBBBBBBBBBBBBBBBBBBBBBBBBBBBBBBBBBBBBBBBBBBBBBBBBBBBBBBBBBBBBBBBBBBBBBBBBBB WK,QWHUQDWLRQDO6KRUW&RQIHUHQFHRQ$SSOLHG&RDVWDO5HVHDUFK WKWK-XQH5:7+$DFKHQ8QLYHUVLW\*HUPDQ\ BBBBBBBBBBBBBBBBBBBBBBBBBBBBBBBBBBBBBBBBBBBBBBBBBBBBBBBBBBBBBBBBBBBBBBBBBBBBBBBBBBBBBBBBBBBBBBB measures to control the situation and minimize the risk on flooding of the city center. The safety limit was set at an overtopping discharge of 1l/s/m during the 1000year storm. As input for the scale model tests, a numerical diffraction model has been used to estimate the disturbance coefficients KD inside the harbor. This coefficient needs to be applied to the incoming wave through the entrance between the new breakwaters. The wave conditions at the critical locations were determined. All scale model tests have been carried out in the 2D wave flume of Ghent University. This flume is 30m long, 1m wide and 1.2m high. The geometric and hydraulic boundary conditions have been scaled down using a Froude scale model with scale factor of 20. The overtopping discharge was captured in a 20cm wide tray, positioned on the crest of the structure in the middle of the 1m wide flume. This tray led the water to a basin, which was weighed continuously on a balance to determine the weight (volume) of the overtopped water. Since it’s a 2D flume only long-crested perpendicular wave impacts can be tested, while in reality 3D short-crested and oblique waves occur along the quay walls in the harbor. This research project is to be used as input for the model tests in a 3D wave basin, to gain time and money: only final geometries deducted from the 2D research have to be tested in the 3D basin. This paper treats wave overtopping over vertical walls (the harbor quay walls), and the reductive measures taken to control this situation. Not the specific results for the case of Oostende will be handled, but some remarkable and general conclusions from this project will be explained. In this research projects, only waves with very low wave steepness (low wave height, long wave period) are tested. Therefore, results might not be generally valid, but only within the tested range of parameters. In the next paragraph 2, a simple storm wall is proposed as reductive measure. In the research project, this wall was positioned at 2m and 15m away from the quay. This paragraph handles about the reduction due to the distance away from the quay. In paragraph 3 different architectural measures are proposed to come up with a reduction of the freeboard to guarantee the same safety level in the city behind the quay walls, or to reduce the overtopping discharges when the same freeboard is maintained. Conclusions are made in the last paragraph. 2 Storm wall at different locations 2.1 Reference case The hydraulic boundary conditions in front of the first critical location were estimated at Hm0 = 2m, and TP = 10s. This corresponds with waves of steepness s0 of 1.3%. This wave steepness is kept constant during the test series in paragraph 2, while the wave height and wave period increase. At first, a reference case has been tested: waves overtopping a simple vertical wall. Since the water level during the 1000 year storm (SWL = TAW + 7.20m, including 0.30m sea level rise) is higher than the original quay wall (crest level TAW + 7.00m), there was no use of testing this high water level for the original quay wall. The daily high water tide (TAW + 4.70m) and the storm level of the 100 year storm (TAW + 6.70m, including 0.30m sea level rise) have been tested instead. Another geometry has been added to this “reference case”, where the overtopping discharge is captured at 2m behind the crest. This geometry is called “berm 2m” (see Figure 2). Figure 2: Berm 0m (left) and berm 2m (right): no difference in wave overtopping discharge. BBBBBBBBBBBBBBBBBBBBBBBBBBBBBBBBBBBBBBBBBBBBBBBBBBBBBBBBBBBBBBBBBBBBBBBBBBBBBBBBBBBBBBBBBBBBBBB WK,QWHUQDWLRQDO6KRUW&RQIHUHQFHRQ$SSOLHG&RDVWDO5HVHDUFK WKWK-XQH5:7+$DFKHQ8QLYHUVLW\*HUPDQ\ BBBBBBBBBBBBBBBBBBBBBBBBBBBBBBBBBBBBBBBBBBBBBBBBBBBBBBBBBBBBBBBBBBBBBBBBBBBBBBBBBBBBBBBBBBBBBBB No difference in overtopping discharge was distinguished, since all water coming over the quay wall is also captured 2m further (see Figure 3: no clear difference between red and blue symbols exists). Figure 3: Dimensionless graph on overtopping discharge over a vertical wall (semi-logarithmic). The data are presented in a typical semi logarithmic overtopping graph, where the dimensionless overtopping discharge is plotted on the Y-axis, the dimensionless freeboard on the X-axis. The black line is drawn as best fitting curve through the data from “berm 0m” and “berm 2m”. This line is now called Reference Line 1, to which all other tested geometries in this paragraph can be compared. 2.2 Storm wall at 2m behind the quay wall The zone behind the quay wall is an open space, with possibility to build storm walls at certain distances behind the quay wall. A permanent or a mobile storm wall may be build. The latter can be constructed after a storm alert, for example by the fire department (see figure 4) Figure 4: Firemen setting up the mobile storm wall. To determine the necessary height and ideal location of these storm walls, model tests have been carried out. The tested water level now was TAW + 6.70m and TAW + 7.20m. A storm wall of different heights was built at 2m behind the quay wall, see Figure 5. BBBBBBBBBBBBBBBBBBBBBBBBBBBBBBBBBBBBBBBBBBBBBBBBBBBBBBBBBBBBBBBBBBBBBBBBBBBBBBBBBBBBBBBBBBBBBBB WK,QWHUQDWLRQDO6KRUW&RQIHUHQFHRQ$SSOLHG&RDVWDO5HVHDUFK WKWK-XQH5:7+$DFKHQ8QLYHUVLW\*HUPDQ\ BBBBBBBBBBBBBBBBBBBBBBBBBBBBBBBBBBBBBBBBBBBBBBBBBBBBBBBBBBBBBBBBBBBBBBBBBBBBBBBBBBBBBBBBBBBBBBB Figure 5: A storm wall at 2m behind the quay. 0 0,5 1 1,5 2 2,5 1,E+00 1,EͲ01 berm2m_wall 0.4m berm2m_wall 0.8m 1,EͲ02 1,EͲ03 1,EͲ04 1,EͲ05 1,EͲ06 Figure 6: Dimensionless overtopping discharges over a storm wall located at 2m behind the quay. Figure 6 clearly shows that nearly all data points are located above the Reference Line 1, deducted in Figure 3. This means that, for an equal freeboard RC (see figure 7), a wave with height Hm0 gives more overtopping when there is a storm wall at 2m distance from the quay wall (red star) than when the quay level is increased to the same level, without berm (blue star). The reason for this could be that when the berm is filled with water from a first wave, it helps the second incoming wave. It’s like there is a triangular slope to “help” the next waves overtop the structure. Even though there is a berm, it has a negative influence! Figure 7: Two situations with the same freeboard RC: left without storm wall but higher quay level, right with storm wall. BBBBBBBBBBBBBBBBBBBBBBBBBBBBBBBBBBBBBBBBBBBBBBBBBBBBBBBBBBBBBBBBBBBBBBBBBBBBBBBBBBBBBBBBBBBBBBB WK,QWHUQDWLRQDO6KRUW&RQIHUHQFHRQ$SSOLHG&RDVWDO5HVHDUFK WKWK-XQH5:7+$DFKHQ8QLYHUVLW\*HUPDQ\ BBBBBBBBBBBBBBBBBBBBBBBBBBBBBBBBBBBBBBBBBBBBBBBBBBBBBBBBBBBBBBBBBBBBBBBBBBBBBBBBBBBBBBBBBBBBBBB 2.3 Storm wall at 15m behind the quay wall Tests have been carried out with a storm wall further away from the quay: 15m (see Figure 8). The height of the tested storm walls and the wave conditions remained the same, for good comparison of the results. Figure 8: A storm wall at 15m behind the quay. 0 0,5 1 1,5 2 2,5 1,E+00 ReferenceLine1 1,EͲ01 1,EͲ02 berm15m_wall 0.4m 1,EͲ03 1,EͲ04 1,EͲ05 1,EͲ06 Figure 9: Dimensionless overtopping discharges over a storm wall located at 15m behind the quay wall. For a longer berm (15m), this negative influence disappears: all purple data points are located below the reference line, see Figure 9. For the low steepness waves, the long berm (15m) reduces the wave overtopping while the short berm (2m) increases the wave overtopping, compared to a normal quay wall with the same freeboard. 3 Architectural measures A second purpose of this research project was to study whether the implementation of architectural elements, without changing the crest level, could be used to reduce wave overtopping on critical locations. For a second critical location in the harbour, the wave conditions were estimated at Hm0 = 1.25m, TP = 12s and s0 = 0.6%. The geometry of the second critical location is shown in Figure 10. Figure 10: Geometry of the quay at a second critical location (Reference Line 2). BBBBBBBBBBBBBBBBBBBBBBBBBBBBBBBBBBBBBBBBBBBBBBBBBBBBBBBBBBBBBBBBBBBBBBBBBBBBBBBBBBBBBBBBBBBBBBB WK,QWHUQDWLRQDO6KRUW&RQIHUHQFHRQ$SSOLHG&RDVWDO5HVHDUFK WKWK-XQH5:7+$DFKHQ8QLYHUVLW\*HUPDQ\ BBBBBBBBBBBBBBBBBBBBBBBBBBBBBBBBBBBBBBBBBBBBBBBBBBBBBBBBBBBBBBBBBBBBBBBBBBBBBBBBBBBBBBBBBBBBBBB Tests have been carried out on the geometry of Figure 10 with s0 = 0.6% kept constant during the whole test series. The geometrical variants which were tested are presented in Figure 11 to Figure 13: three wide steps of each 5m wide and 0.4m high (Figure 11), five short steps of each 20cm high and 30cm wide in the middle of the 15m wide platform (Figure 12), and three wide steps combined with open rows of storm walls (Figure 13). Figure 11: Three steps of each 5m wide. Figure 12: Short steps in the middle of the quay platform. Figure 13: Wide steps with two open rows of walls. 1 open row walls at the seaside of 0.8m high, 1 open row on the first step of 0.4m high. The data of the four proposed geometries (Figure 10 to Figure 13) are presented in a semilogarithmic overtopping diagram, see Figure 14. 0 0,5 1 1,5 2 2,5 1,E+00 ReferenceLine2 1,EͲ01 widesteps 1,EͲ02 1,EͲ03 1,EͲ04 1,EͲ05 1,EͲ06 Figure 14: Dimensionless overtopping graph of all geometries related to the standard geometry (Reference Line 2). The data of the standard geometry (Figure 10) are presented in red. The red line acts as Reference Line 2, to which the other three geometries can be compared. The same data can also be plotted in a non-dimensionless representation, see Figure 15. BBBBBBBBBBBBBBBBBBBBBBBBBBBBBBBBBBBBBBBBBBBBBBBBBBBBBBBBBBBBBBBBBBBBBBBBBBBBBBBBBBBBBBBBBBBBBBB WK,QWHUQDWLRQDO6KRUW&RQIHUHQFHRQ$SSOLHG&RDVWDO5HVHDUFK WKWK-XQH5:7+$DFKHQ8QLYHUVLW\*HUPDQ\ BBBBBBBBBBBBBBBBBBBBBBBBBBBBBBBBBBBBBBBBBBBBBBBBBBBBBBBBBBBBBBBBBBBBBBBBBBBBBBBBBBBBBBBBBBBBBBB Figure 15: Non-dimensionless overtopping graph of all geometries related to Reference Line 2. As can be seen from both Figure 14 and 15, the wide steps (blue data) have nearly no influence on the overtopping measured at the crest of the storm wall at TAW + 8.35m. The short steps in the middle of the quay platform (purple data) have a (severe) negative influence. The steps act as a steep slope, which encourages the incoming wave to overtop this structure. More water is overtopping the landward crest of the storm wall at TAW + 8.35m. The best reduction is, as expected, obtained by creating a kind of stilling wave basin (green data). The principle of this basin, first mentioned by Geeraerts et al (1996), is to allow waves to overtop the seaward wall. These waves “jump up against the wall and drop dead in a basin”, run back and forth between both rows of walls (which are open to let water evacuate, see Figure 18 top view) meanwhile losing their energy. They don’t have enough energy left to overtop the landward wall. The open walls can easily be integrated in the (touristic) setting, for example by using benches. The reductive capacity can even be increased by changing the walls into parapets. This is done by adding a “nose” to the wall, creating a recurve wall (see figure 16 and 17 side view). Figure 16: A parapet (recurve wall). BBBBBBBBBBBBBBBBBBBBBBBBBBBBBBBBBBBBBBBBBBBBBBBBBBBBBBBBBBBBBBBBBBBBBBBBBBBBBBBBBBBBBBBBBBBBBBB WK,QWHUQDWLRQDO6KRUW&RQIHUHQFHRQ$SSOLHG&RDVWDO5HVHDUFK WKWK-XQH5:7+$DFKHQ8QLYHUVLW\*HUPDQ\ BBBBBBBBBBBBBBBBBBBBBBBBBBBBBBBBBBBBBBBBBBBBBBBBBBBBBBBBBBBBBBBBBBBBBBBBBBBBBBBBBBBBBBBBBBBBBBB Figure 17: Reducing wave overtopping by changing the open row of walls by parapets, side view. Figure 18: Top view of Figure 17, two open row of walls (with green parapet-nose) creating the stilling wave basin. 4 Conclusion Traditionally in coastal engineering, one looks for the necessary freeboard, the height of the construction, to limit the overtopping discharge to a certain level (e.g. q = 1l/s/m). This research project has shown that the presence of steps, or a storm wall close by the quay wall can even increase the overtopping discharge (when comparing two geometries with the same freeboard!!). x A storm wall at 2m away from the quay wall is more easily overtopped than a quay wall with the same height, while a storm wall at 15m away from the quay reduces the wave overtopping. x Short steps on the quay platform act as a steep slope and stimulate wave overtopping. x Two open rows of storm walls (Figure 17 and 18) work as a stilling wave basin, and reduce the wave overtopping drastically. This paper proves that it is always strongly advised to carry out model tests, especially in case of non-typical layouts. Even small adaptations to the basic geometry, with preservation of the crest freeboard, can have severe negative influences on the overtopping discharge. 5 References Geeraerts, J., De Rouck, J., Beels, C., Gysens, S. and De Wolf, P. (2006) Reduction of wave overtopping at sea dikes: stilling wave basin (SWB). ASCE, Proc. ICCE 2006, San Diego, Volume 5 – pp. 4680-4691 Verhaeghe, H., Van Damme, L., Goemaere, J., De Rouck, J., Van Alboom, W.(2010) Construction of two new breakwaters at Ostend leading to an improved harbor acces. Proc. ICCE 2010, Shanghai Van Doorslaer, K., De Rouck, J. (2010) Reduction of wave overtopping on a smooth dike by means of a parapet. Proc. ICCE 2010, Shanghai BBBBBBBBBBBBBBBBBBBBBBBBBBBBBBBBBBBBBBBBBBBBBBBBBBBBBBBBBBBBBBBBBBBBBBBBBBBBBBBBBBBBBBBBBBBBBBB
