1 Part I:
advertisement
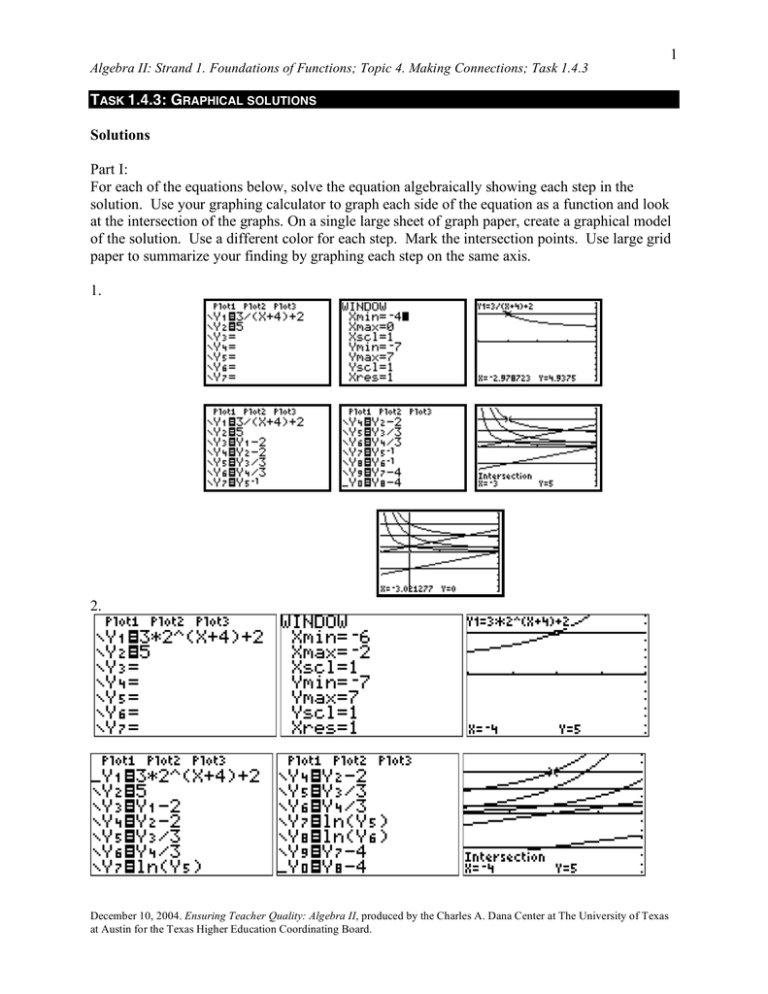
Algebra II: Strand 1. Foundations of Functions; Topic 4. Making Connections; Task 1.4.3 1 TASK 1.4.3: GRAPHICAL SOLUTIONS Solutions Part I: For each of the equations below, solve the equation algebraically showing each step in the solution. Use your graphing calculator to graph each side of the equation as a function and look at the intersection of the graphs. On a single large sheet of graph paper, create a graphical model of the solution. Use a different color for each step. Mark the intersection points. Use large grid paper to summarize your finding by graphing each step on the same axis. 1. 2. December 10, 2004. Ensuring Teacher Quality: Algebra II, produced by the Charles A. Dana Center at The University of Texas at Austin for the Texas Higher Education Coordinating Board. Algebra II: Strand 1. Foundations of Functions; Topic 4. Making Connections; Task 1.4.3 2 3. At this point, we have to reason to find the inverse of the greatest integer function. We now have the equation [x + 4] = 1. Therefore, 1 ! x + 4 < 2 and thus, !3 " x < !2 . 4. December 10, 2004. Ensuring Teacher Quality: Algebra II, produced by the Charles A. Dana Center at The University of Texas at Austin for the Texas Higher Education Coordinating Board. Algebra II: Strand 1. Foundations of Functions; Topic 4. Making Connections; Task 1.4.3 3 Part II: x 4x ! 3 +x= x !1 x !1 x % " 4x ! 3 % + x ' = ( x ! 1) $ #x !1 & # x ! 1 '& ( x ! 1) "$ Notice the holes in both graphs where they are undefined at x = 1 . x + ( x ! 1) x = 4x ! 3 Above is the step where the extraneous solution is introduced. x 2 ! 4x + 3 = 0 Math notes It is important to bring out the fact that the intersections of the two curves stays the same at each step of the process (however, sometimes extraneous roots are introduced). Teaching notes This task is designed to help participants connect the algebraic and graphical solution of an equation at each step. It is important to bring students back to the question “What stays the same.” As the groups report their work, point out that the transformations are the same no matter what the parent function is. Technology notes Remember that when defining Y3 in terms of say, Y1, one cannot type in Y1—one must go to VARS and choose Y1. Also, use the DRAW button to draw horizontal or vertical lines in given locations on your graphs. December 10, 2004. Ensuring Teacher Quality: Algebra II, produced by the Charles A. Dana Center at The University of Texas at Austin for the Texas Higher Education Coordinating Board. Algebra II: Strand 1. Foundations of Functions; Topic 4. Making Connections; Task 1.4.3 Note on problem 3: Make sure participants understand the difference between the greatest common integer function and the display on the calculator screen. The calculator “connects the dots”, hence the vertical appearing lines to connect the horizontal pieces. December 10, 2004. Ensuring Teacher Quality: Algebra II, produced by the Charles A. Dana Center at The University of Texas at Austin for the Texas Higher Education Coordinating Board. 4 Algebra II: Strand 1. Foundations of Functions; Topic 4. Making Connections; Task 1.4.3 5 TASK 1.4.3: GRAPHICAL SOLUTIONS Part I: For each of the equations below, solve the equation algebraically showing each step in the solution. Use your graphing calculator to graph each side of the equation as a function and look at the intersection of the graphs. On a single large sheet of graph paper, create a graphical model of the solution. Use a different color for each step. Mark the intersection points. Use large grid paper to summarize your finding by graphing each step on the same axis. 1. 2. 3. 4. 1 $ & +2=5 " x + 4% ! 3# ! ! # 3# 2" #" x+4$&% $ & +2=5 &% 3[x + 4] + 2 = 5 x+2 = x December 10, 2004. Ensuring Teacher Quality: Algebra II, produced by the Charles A. Dana Center at The University of Texas at Austin for the Texas Higher Education Coordinating Board. Algebra II: Strand 1. Foundations of Functions; Topic 4. Making Connections; Task 1.4.3 Part II: 1. Shown below are steps in the algebraic solution of the first equation. Graph each of the equations and show where the extraneous solution appears. (1) x + x = 4x ! 3 x !1 x !1 (2) ! 3% ( x !1) "$# x x!1 + x %'& = ( x !1) "$# 4xx !1 ' & (3) x + ( x !1) x = 4x ! 3 (4) x 2 ! 4x + 3 = 0 (5) x = 1, 3 December 10, 2004. Ensuring Teacher Quality: Algebra II, produced by the Charles A. Dana Center at The University of Texas at Austin for the Texas Higher Education Coordinating Board. 6
