Document 11665284
advertisement

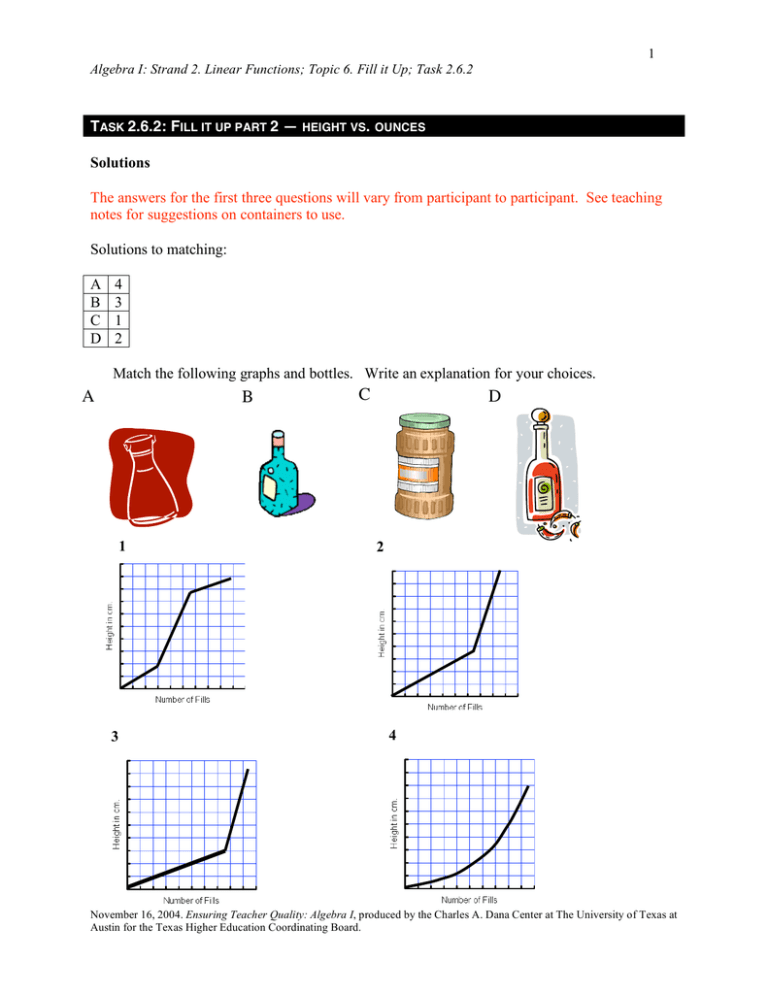
1 Algebra I: Strand 2. Linear Functions; Topic 6. Fill it Up; Task 2.6.2 TASK 2.6.2: FILL IT UP PART 2 — HEIGHT VS. OUNCES Solutions The answers for the first three questions will vary from participant to participant. See teaching notes for suggestions on containers to use. Solutions to matching: A B C D 4 3 1 2 Match the following graphs and bottles. Write an explanation for your choices. A B 1 3 C D 2 4 November 16, 2004. Ensuring Teacher Quality: Algebra I, produced by the Charles A. Dana Center at The University of Texas at Austin for the Texas Higher Education Coordinating Board. 2 Algebra I: Strand 2. Linear Functions; Topic 6. Fill it Up; Task 2.6.2 Teaching notes This activity will be the same as part one, except the containers will change. Students need to be provided containers that are not rectangular prisms or cylinders. Wesson Oil™ bottles work well, as do Windex™ bottles. The goal is to have very different shapes that will not give linear results when graphing. It is very important in both of these exercises that students spend time on their predictions. An accurate prediction requires the student to relate the rate of change in the height of the water to the amount added and making a reasonable judgment. In part 2, since the results won’t be linear, the student will have to think about narrower bottles resulting in a faster rate of change. They will also have to estimate how many ounces each cross-section of volume will hold. November 16, 2004. Ensuring Teacher Quality: Algebra I, produced by the Charles A. Dana Center at The University of Texas at Austin for the Texas Higher Education Coordinating Board. 3 Algebra I: Strand 2. Linear Functions; Topic 6. Fill it Up; Task 2.6.2 TASK 2.6.2: FILL IT UP PART 2 — HEIGHT VS. OUNCES • Before you begin – read through the directions and make sure your group has all the materials for this exploration. You will need: o Ruler o Chart paper o Container o Graphing calculator o Measuring cup o Container of water Directions • Study your container and on the back of your chart paper, sketch a prediction of height vs. ounces. • Very carefully, measure 2 ounces of water using the measuring cup. • Pour the 2 ounces into your container. • Use a ruler held to the side of your container to measure the height of the water to the nearest millimeter. • Record the data and continue the process until your container is full. • Graph your data on the chart paper provided by your teacher; be sure to label the axes. • Answer the questions below. 1. Explain how you decided on your prediction graph. 2. Compare your prediction graph and your data based graph. Explain similarities and differences. 3. In words write a description of what is happening in your graph as it relates to the water in your container. November 16, 2004. Ensuring Teacher Quality: Algebra I, produced by the Charles A. Dana Center at The University of Texas at Austin for the Texas Higher Education Coordinating Board. 4 Algebra I: Strand 2. Linear Functions; Topic 6. Fill it Up; Task 2.6.2 Match the following graphs and bottles. Write an explanation for your choices. A 1 3 C B D 2 4 November 16, 2004. Ensuring Teacher Quality: Algebra I, produced by the Charles A. Dana Center at The University of Texas at Austin for the Texas Higher Education Coordinating Board.
