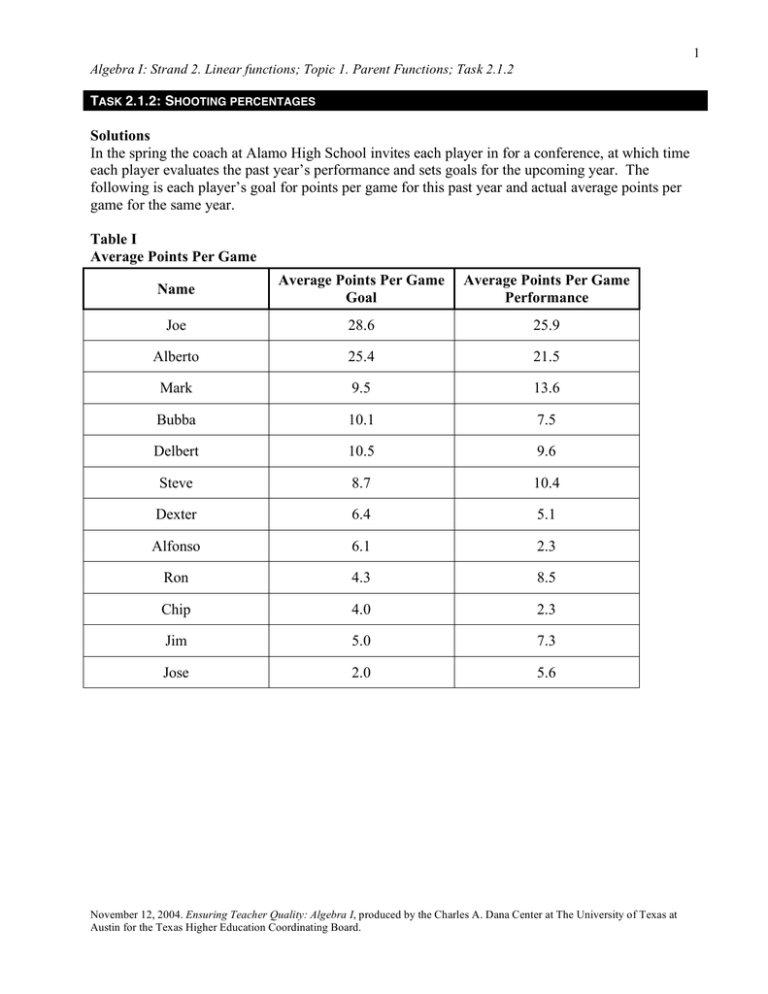
Solutions In the spring the coach at Alamo High School invites... each player evaluates the past year’s performance and sets goals...
advertisement

1 Algebra I: Strand 2. Linear functions; Topic 1. Parent Functions; Task 2.1.2 TASK 2.1.2: SHOOTING PERCENTAGES Solutions In the spring the coach at Alamo High School invites each player in for a conference, at which time each player evaluates the past year’s performance and sets goals for the upcoming year. The following is each player’s goal for points per game for this past year and actual average points per game for the same year. Table I Average Points Per Game Name Average Points Per Game Goal Average Points Per Game Performance Joe 28.6 25.9 Alberto 25.4 21.5 Mark 9.5 13.6 Bubba 10.1 7.5 Delbert 10.5 9.6 Steve 8.7 10.4 Dexter 6.4 5.1 Alfonso 6.1 2.3 Ron 4.3 8.5 Chip 4.0 2.3 Jim 5.0 7.3 Jose 2.0 5.6 November 12, 2004. Ensuring Teacher Quality: Algebra I, produced by the Charles A. Dana Center at The University of Texas at Austin for the Texas Higher Education Coordinating Board. 2 Algebra I: Strand 2. Linear functions; Topic 1. Parent Functions; Task 2.1.2 1. Using the coordinate grid, sketch a graph of the data in Table I. Label the axes appropriately. Justify your choice for independent variable and your choice for dependent variable. Is your data discrete or continuous? What is the range and domain of your data? For this set of data, either variable can be the independent variable or the dependent variable. There is no correct choice but participants must justify their choice. This set of data is discrete, since the domain of the independent variable is a discrete set. The choice for the independent variable determines the domain of the function; the range of the function is dependent on the domain. Specifically, the values recorded in Table I represent the domain and the range. Q Questions for participants to consider: • • • • • • • How well did the players estimate? How do you think we can judge if they are good estimators? How do you think we could tell if they overestimated? How do you think we could tell if they underestimated? Does it matter which variable you choose as the dependent variable? How would your graph change if you chose a different dependent variable? How would the two graphs compare? Q 2. Using your data, create a scatter plot on your graphing calculator. Given the box as your calculator window, sketch your scatter plot including the axes and scale. Justify your viewing window choice. The variable x stands for the average points per game goal, so x min is 0 points per game and x max is the maximum number of points per goal (Table I). The variable y stands for points per game performance, so y min is 0 points per game and y max is the maximum number of points per game performance (Table I). November 12, 2004. Ensuring Teacher Quality: Algebra I, produced by the Charles A. Dana Center at The University of Texas at Austin for the Texas Higher Education Coordinating Board. 3 Algebra I: Strand 2. Linear functions; Topic 1. Parent Functions; Task 2.1.2 3. Using your calculator, graph the “perfect-estimator” line over the scatter plot. 4. Did the team overestimate or underestimate? Explain. If the points lie mostly above the line, then the players underestimated their performance. If the points lie mostly below the line, then the players overestimated their performance. According to the data in Table I, most players overestimated their performance. 5. Is the relationship between average points per game goal and average points per game performance proportional? Is it a direct variation? Justify your answer. Unless the players’ goal “perfectly” matched performance, then the relationship between average points per game goal and average points per game performance is not proportional, so it is not a direct variation. Only with a perfect match between average points per game goal and average points per game performance estimation will the line include the origin. Math notes Ask participants to sketch a “perfect-estimate” line, a line that represents perfect match between average points per game goal and average points per game performance. Ask participants to write a sentence to describe the “perfect-estimate” line and then translate to symbols. Example: “All of the players average points per game performance match their average points goal for the season.” Goal average points per game = average points per game performance A = P or y = x November 12, 2004. Ensuring Teacher Quality: Algebra I, produced by the Charles A. Dana Center at The University of Texas at Austin for the Texas Higher Education Coordinating Board. 4 Algebra I: Strand 2. Linear functions; Topic 1. Parent Functions; Task 2.1.2 TASK 2.1.2: SHOOTING PERCENTAGES In the spring the coach at Alamo High School invites each player in for a conference, at which time each player evaluates the past year’s performance and sets goals for the following year. The following is each player’s goal for points per game for this past year and actual average points per game for the same year. Table I Average Points Per Game Name Average Points Per Game Goal Average Points Per Game Performance Joe 28.6 25.9 Alan 25.4 21.5 Mark 9.5 13.6 Bubba 10.1 7.5 Delbert 10.5 9.6 Steve 8.7 10.4 Larry 6.4 5.1 Jerry 6.1 2.3 Ron 4.3 8.5 Chip 4.0 2.3 Jim 4.0 7.3 Chris 4.0 5.6 November 12, 2004. Ensuring Teacher Quality: Algebra I, produced by the Charles A. Dana Center at The University of Texas at Austin for the Texas Higher Education Coordinating Board. 5 Algebra I: Strand 2. Linear functions; Topic 1. Parent Functions; Task 2.1.2 1. Using the coordinate grid sketch a graph of the data in Table I. Label the axes appropriately. Justify your choice for independent variable and your choice for dependent variable. Is your data discrete or continuous? What is the range and domain of your data? 2. Using your data, create a scatter plot on your graphing calculator. Given the box as your calculator window, sketch your scatter plot including the axes and scale. Justify your viewing window choice. November 12, 2004. Ensuring Teacher Quality: Algebra I, produced by the Charles A. Dana Center at The University of Texas at Austin for the Texas Higher Education Coordinating Board. 6 Algebra I: Strand 2. Linear functions; Topic 1. Parent Functions; Task 2.1.2 3. Using your calculator, graph the “perfect-estimator” line over the scatter plot. 4. Did the team overestimate or underestimate? Explain. 5. Is the relationship between average points per game goal and the average points per game performance proportional? Is it a direct variation? Justify your answer. November 12, 2004. Ensuring Teacher Quality: Algebra I, produced by the Charles A. Dana Center at The University of Texas at Austin for the Texas Higher Education Coordinating Board.
