Lab 3
advertisement

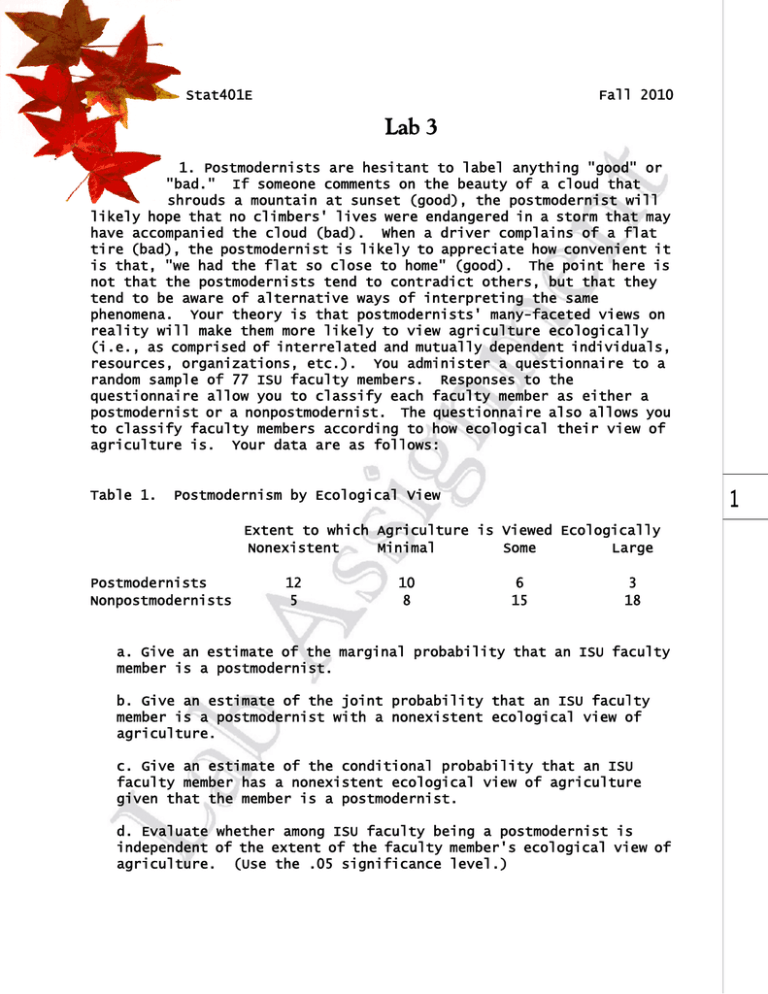
Stat401E Fall 2010 Lab 3 1. Postmodernists are hesitant to label anything "good" or "bad." If someone comments on the beauty of a cloud that shrouds a mountain at sunset (good), the postmodernist will likely hope that no climbers' lives were endangered in a storm that may have accompanied the cloud (bad). When a driver complains of a flat tire (bad), the postmodernist is likely to appreciate how convenient it is that, "we had the flat so close to home" (good). The point here is not that the postmodernists tend to contradict others, but that they tend to be aware of alternative ways of interpreting the same phenomena. Your theory is that postmodernists' many-faceted views on reality will make them more likely to view agriculture ecologically (i.e., as comprised of interrelated and mutually dependent individuals, resources, organizations, etc.). You administer a questionnaire to a random sample of 77 ISU faculty members. Responses to the questionnaire allow you to classify each faculty member as either a postmodernist or a nonpostmodernist. The questionnaire also allows you to classify faculty members according to how ecological their view of agriculture is. Your data are as follows: Table 1. Postmodernism by Ecological View 1 Extent to which Agriculture is Viewed Ecologically Nonexistent Minimal Some Large Postmodernists Nonpostmodernists 12 5 10 8 6 15 3 18 a. Give an estimate of the marginal probability that an ISU faculty member is a postmodernist. b. Give an estimate of the joint probability that an ISU faculty member is a postmodernist with a nonexistent ecological view of agriculture. c. Give an estimate of the conditional probability that an ISU faculty member has a nonexistent ecological view of agriculture given that the member is a postmodernist. d. Evaluate whether among ISU faculty being a postmodernist is independent of the extent of the faculty member's ecological view of agriculture. (Use the .05 significance level.) e. Do the data in table 1 provide evidence in support of your theory? (Explain and provide evidence for your answer. Hint: Find some conditional probabilities that lend support to your argument.) 2. You wish to draw a two-stage cluster sample (i.e., a multistage cluster sample with two stages) of households from a city of 100,000 households using probability proportionate to size (PPS) sampling. The city is composed of 2,000 blocks and you wish to draw a sample of 1000 households by selecting 5 households from each of 200 blocks. a. Let's assume that a block with 100 households is selected and 5 households are to be randomly selected from among these 100. Given that one is sampling within this block, what is the probability that any one of the households within the block is selected? b. In drawing the PPS sample, each household in the city must have the same probability of being included in the final sample. What is this probability for a sample of 1000 households? c. Using the probability found in part "b" (i.e., the probability that any one of the city's households will be included in the final sample) and assuming that you have accurate estimates of the numbers of households to be found on each city block, with what probability would you wish to sample a block containing "k" households? Show how you arrived at your answer! (Note that you must assume that each block contains less than 500 households.) 3. Solve both of the following for k. (Hints: Assume that k is a positive constant. Part a has a solution for k that is a real number; part b does not. Again, you may wish to (optionally) try checking your solutions by substituting them back into the original equations.): k a. 3k = 2 k +8 i=1 n 1 b. --n k k – Xi = 5 i=1 i=1 2


