ICES CM 2010/L:32
advertisement

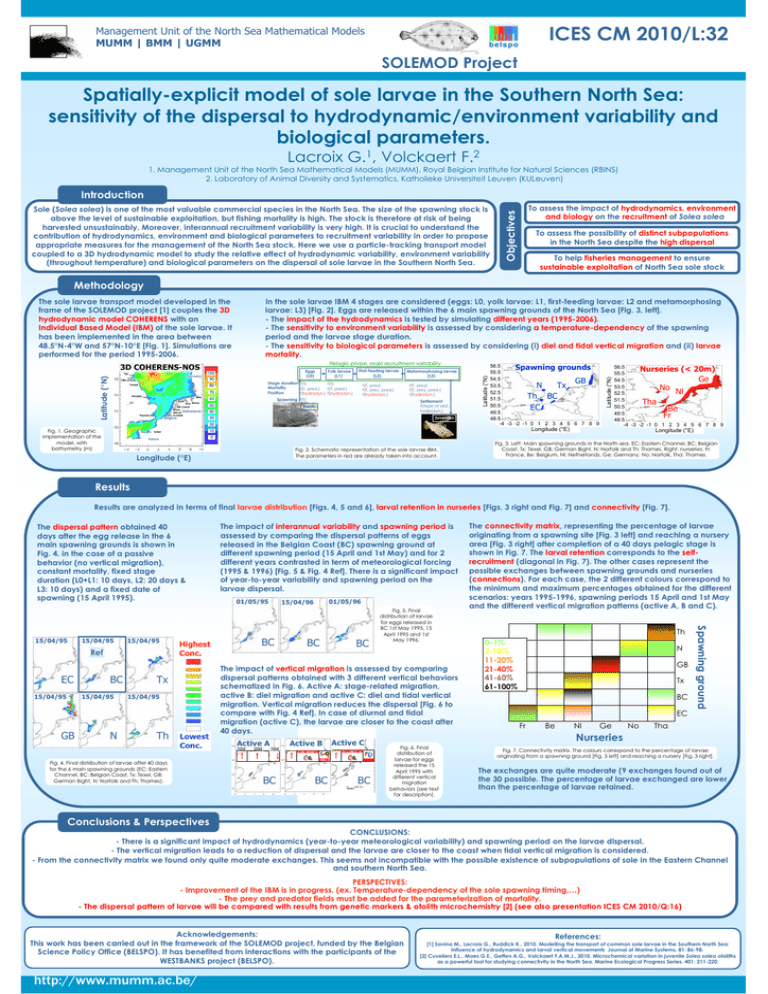
ICES CM 2010/L:32 Management Unit of the North Sea Mathematical Models MUMM | BMM | UGMM SOLEMOD Project Spatially-explicit model of sole larvae in the Southern North Sea: sensitivity of the dispersal to hydrodynamic/environment variability and biological parameters. Lacroix G.1, Volckaert F.2 1. Management Unit of the North Sea Mathematical Models (MUMM), Royal Belgian Institute for Natural Sciences (RBINS) 2. Laboratory of Animal Diversity and Systematics, Katholieke Universiteit Leuven (KULeuven) Introduction To assess the impact of hydrodynamics, environment and biology on the recruitment of Solea solea Objectives Sole (Solea solea) is one of the most valuable commercial species in the North Sea. The size of the spawning stock is above the level of sustainable exploitation, but fishing mortality is high. The stock is therefore at risk of being harvested unsustainably. Moreover, interannual recruitment variability is very high. It is crucial to understand the contribution of hydrodynamics, environment and biological parameters to recruitment variability in order to propose appropriate measures for the management of the North Sea stock. Here we use a particle-tracking transport model coupled to a 3D hydrodynamic model to study the relative effect of hydrodynamic variability, environment variability (throughout temperature) and biological parameters on the dispersal of sole larvae in the Southern North Sea. To assess the possibility of distinct subpopulations in the North Sea despite the high dispersal To help fisheries management to ensure sustainable exploitation of North Sea sole stock Methodology In the sole larvae IBM 4 stages are considered (eggs: L0, yolk larvae: L1, first-feeding larvae: L2 and metamorphosing larvae: L3) [Fig. 2]. Eggs are released within the 6 main spawning grounds of the North Sea [Fig. 3, left]. - The impact of the hydrodynamics is tested by simulating different years (1995-2006). - The sensitivity to environment variability is assessed by considering a temperature-dependency of the spawning period and the larvae stage duration. - The sensitivity to biological parameters is assessed by considering (i) diel and tidal vertical migration and (ii) larvae mortality. Latitude (°N) Tay Germany Pelagic phase, main recruitment variability Eggs (L0) 100 Fifth of forth 90 70 Humber Elbe Ijssel UK Ems Weser NS Canal Rhine Netherlands Meuse Scheldt Thames Belgium First-feeding larvae (L2) Stage duration f(T) f(T) Mortality f(T, pred.) f(T, pred.) Position f(hydrodyn.) f(hydrodyn.) 80 Tweed Yolk larvae (L1) 60 f(T, prey) f(T, prey, pred.) f(hydrodyn.) Spawning f(T) 50 Metamorphosing larvae (L3) f(T, prey) f(T, prey, pred.) f(hydrodyn.) Settlement F(type of sed., hydrodyn.) Adults 40 Juveniles 30 20 Fig. 1. Geographic implementation of the model, with bathymetry (m) Latitude (°N) 3D COHERENS-NOS 56.5 Spawning grounds 55.5 54.5 GB 53.5 N Tx 52.5 Th BC 51.5 50.5 EC 49.5 48.5 -4 -3 -2 -1 0 1 2 3 4 5 6 7 8 9 Longitude (°E) 10 Seine Latitude (°N) The sole larvae transport model developed in the frame of the SOLEMOD project [1] couples the 3D hydrodynamic model COHERENS with an Individual Based Model (IBM) of the sole larvae. It has been implemented in the area between 48.5°N-4°W and 57°N-10°E [Fig. 1]. Simulations are performed for the period 1995-2006. 56.5 Nurseries (< 20m) 55.5 54.5 Ge 53.5 No Nl 52.5 51.5 Tha 50.5 Be 49.5 Fr 48.5 -4 -3 -2 -1 0 1 2 3 4 5 6 7 8 9 Longitude (°E) 0 France Fig. 2. Schematic representation of the sole larvae IBM. The parameters in red are already taken into account. Longitude (°E) Fig. 3. Left: Main spawning grounds in the North sea. EC: Eastern Channel, BC: Belgian Coast, Tx: Texel, GB: German Bight, N: Norfolk and Th: Thames. Right: nurseries. Fr: France, Be: Belgium, Nl: Netherlands, Ge: Germany, No: Norfolk, Tha: Thames. Results Results are analyzed in terms of final larvae distribution [Figs. 4, 5 and 6], larval retention in nurseries [Figs. 3 right and Fig. 7] and connectivity [Fig. 7]. The dispersal pattern obtained 40 days after the egg release in the 6 main spawning grounds is shown in Fig. 4. in the case of a passive behavior (no vertical migration), constant mortality, fixed stage duration (L0+L1: 10 days, L2: 20 days & L3: 10 days) and a fixed date of spawning (15 April 1995). 15/04/95 15/04/95 Ref EC 15/04/95 BC 15/04/95 GB N 15/04/95 Lowest Conc. Fig. 4. Final distribution of larvae after 40 days for the 6 main spawning grounds (EC: Eastern Channel, BC: Belgian Coast, Tx: Texel, GB: German Bight, N: Norfolk and Th: Thames). 01/05/96 15/04/96 BC Highest Conc. Tx Th 01/05/95 BC BC Fig. 5. Final distribution of larvae for eggs released in BC 1st May 1995, 15 April 1995 and 1st May 1996. The impact of vertical migration is assessed by comparing dispersal patterns obtained with 3 different vertical behaviors schematized in Fig. 6. Active A: stage-related migration, active B: diel migration and active C: diel and tidal vertical migration. Vertical migration reduces the dispersal [Fig. 6 to compare with Fig. 4 Ref]. In case of diurnal and tidal migration (active C), the larvae are closer to the coast after 40 days. Active A 10d 20d Active B Active C 10d BC BC BC Fig. 6. Final distribution of larvae for eggs released the 15 April 1995 with different vertical migration behaviors (see text for description). The connectivity matrix, representing the percentage of larvae originating from a spawning site [Fig. 3 left] and reaching a nursery area [Fig. 3 right] after completion of a 40 days pelagic stage is shown in Fig. 7. The larval retention corresponds to the selfrecruitment (diagonal in Fig. 7). The other cases represent the possible exchanges between spawning grounds and nurseries (connections). For each case, the 2 different colours correspond to the minimum and maximum percentages obtained for the different scenarios: years 1995-1996, spawning periods 15 April and 1st May and the different vertical migration patterns (active A, B and C). Th 0–1% 2-10% 11-20% 21-40% 41-60% 61-100% N GB Tx BC EC Fr Be Nl Ge No Spawning ground 15/04/95 The impact of interannual variability and spawning period is assessed by comparing the dispersal patterns of eggs released in the Belgian Coast (BC) spawning ground at different spawning period (15 April and 1st May) and for 2 different years contrasted in term of meteorological forcing (1995 & 1996) [Fig. 5 & Fig. 4 Ref]. There is a significant impact of year-to-year variability and spawning period on the larvae dispersal. Tha Nurseries Fig. 7. Connectivity matrix. The colours correspond to the percentage of larvae originating from a spawning ground [Fig. 3 left] and reaching a nursery [Fig. 3 right]. The exchanges are quite moderate (9 exchanges found out of the 30 possible. The percentage of larvae exchanged are lower than the percentage of larvae retained. Conclusions & Perspectives CONCLUSIONS: - There is a significant impact of hydrodynamics (year-to-year meteorological variability) and spawning period on the larvae dispersal. - The vertical migration leads to a reduction of dispersal and the larvae are closer to the coast when tidal vertical migration is considered. - From the connectivity matrix we found only quite moderate exchanges. This seems not incompatible with the possible existence of subpopulations of sole in the Eastern Channel and southern North Sea. PERSPECTIVES: - Improvement of the IBM is in progress. (ex. Temperature-dependency of the sole spawning timing,…) - The prey and predator fields must be added for the parameterization of mortality. - The dispersal pattern of larvae will be compared with results from genetic markers & otolith microchemistry [2] (see also presentation ICES CM 2010/Q:16) Acknowledgements: This work has been carried out in the framework of the SOLEMOD project, funded by the Belgian Science Policy Office (BELSPO). It has benefited from interactions with the participants of the WESTBANKS project (BELSPO). http://www.mumm.ac.be/ References: [1] Savina M., Lacroix G., Ruddick K., 2010. Modelling the transport of common sole larvae in the Southern North Sea: influence of hydrodynamics and larval vertical movements Journal of Marine Systems, 81: 86-98. [2] Cuveliers E.L., Maes G.E., Geffen A.G., Volckaert F.A.M.J., 2010. Microchemical variation in juvenile Solea solea otoliths as a powerful tool for studying connectivity in the North Sea. Marine Ecological Progress Series, 401: 211-220.


