CHAPTER 6 ENVIRONMENTAL CONDITIONS
advertisement
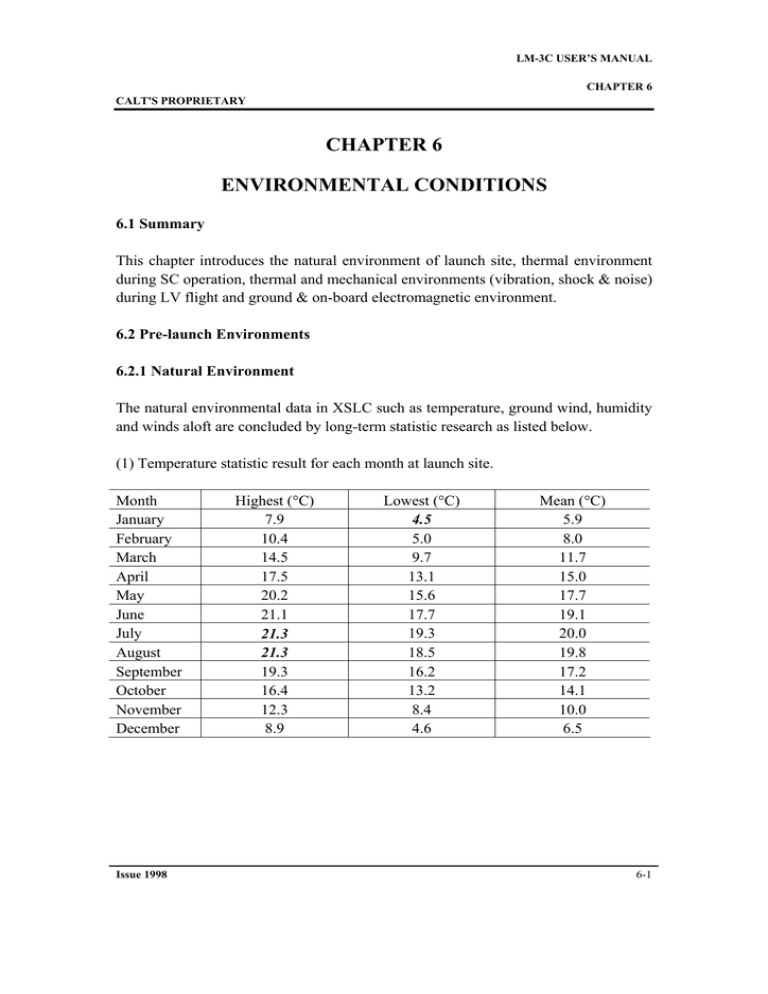
LM-3C USER’S MANUAL CHAPTER 6 CALT'S PROPRIETARY CHAPTER 6 ENVIRONMENTAL CONDITIONS 6.1 Summary This chapter introduces the natural environment of launch site, thermal environment during SC operation, thermal and mechanical environments (vibration, shock & noise) during LV flight and ground & on-board electromagnetic environment. 6.2 Pre-launch Environments 6.2.1 Natural Environment The natural environmental data in XSLC such as temperature, ground wind, humidity and winds aloft are concluded by long-term statistic research as listed below. (1) Temperature statistic result for each month at launch site. Month January February March April May June July August September October November December Issue 1998 Highest (°C) 7.9 10.4 14.5 17.5 20.2 21.1 21.3 21.3 19.3 16.4 12.3 8.9 Lowest (°C) 4.5 5.0 9.7 13.1 15.6 17.7 19.3 18.5 16.2 13.2 8.4 4.6 Mean (°C) 5.9 8.0 11.7 15.0 17.7 19.1 20.0 19.8 17.2 14.1 10.0 6.5 6-1 LM-3C USER’S MANUAL CHAPTER 6 CALT'S PROPRIETARY (2) The ground wind statistic result for each month at launch site Month January February March April May June July August September October November December Mean Speed (m/s) 2.2 2.3 2.3 2.0 1.5 1.0 1.1 1.2 0.9 1.1 1.4 1.7 Days (Speed >13m/s) 0.5 1.1 2.5 1.6 0.6 0.4 0.2 0.1 0.2 0.1 0.0 0.2 (3) The relative humidity at launch site: Maximum: 90% at rain season; Minimum: 42% at dry season. (4) The winds aloft used for LV design is an integrated vector profile, see Figure 6-1. Issue 1998 6-2 LM-3C USER’S MANUAL CHAPTER 6 CALT'S PROPRIETARY Altitude(km) Altitude(km) 25 25 20 20 North Max. Wind Envelope 15 15 10 10 Condition Minimum Wind 5 5 0 0 0 20 40 60 Wind Speed (m/s) 80 100 200 300 250 Wind Direction ( o ) 350 Figure 6-1 Wind Aloft Statistics Results in Xichang Area Issue 1998 6-3 LM-3C USER’S MANUAL CHAPTER 6 CALT'S PROPRIETARY 6.2.2 SC Processing Environment Before launch, SC will be checked, tested in SC Processing Buildings (BS2 and BS3) and then transported to the launch pad for launch. The environment impacting SC includes three phases: process in BS2 and BS3, transportation to launch pad and preparation on launch tower. 6.2.2.1 Environment of SC in BS2 The environmental parameters in BS2 and BS3 are as follows: Temperature: 15°C~25°C Relative humidity: 33%~55% Cleanliness: 100,000 level 6.2.2.2 Environment of SC during Transportation to Launch Pad (1) For Encapsulation-on-pad Method It will take 30 minutes from BS3 to launch pad, during which the SC is put into a sealed container (SC Container) that can ensure the needed environment. The SC Container is a sealed cylindrical container with an available inner space of 7450mm high and 3980mm in diameter. The thermal-insulation wall is made of Aluminum sandwich. See Chapter 8. Before transportation, pure Nitrogen of 15°C~25°C will be filled into the SC Container to make pressurization protection. After the temperature of SC and container reaches 15°C~25°C, the container will be sealed and moved out of BS3. The temperature in the container is variable from 15°C to 25°C, the relative humidity is variable from 35% to 55%, the cleanliness is 100,000 level and the noise during the charging and venting process is lower than 90dB. During the transportation, because the inner pressure of container is higher than the outside air pressure, the cleanliness can be maintained at 100,000 level. After the container is transported to the launch pad, it will be lifted to 8th floor of the Service Tower, where an environmentally controlled area will be established. The detailed procedures are shown in Chapter 8. The environmental conditions in the clean area are listed below: Issue 1998 6-4 LM-3C USER’S MANUAL CHAPTER 6 CALT'S PROPRIETARY Temperature: Relative Humidity: Cleanliness: 15°C~25°C; 35%~55%; 100,000 level. The container will stay in the clean area until the ambient environment meet the requirements, then the container will be opened and the SC will be moved out to mate to the Launch Vehicle. (2) For Encapsulation-in-BS3 Method The SC will be encapsulated directly into the fairing in BS3. The environment in fairing is the same as that in SC container. Before transportation, it is decided according to the specific conditions whether or not the air-conditioning system for the fairing will be introduced. 6.2.3 Air-conditioning inside Fairing Air-conditioning system connecting to the fairing begins to work after the fairing is encapsulated on the launch pad. The fairing air-conditioning system is shown in Figure 6-2. Air-conditioning parameters inside Fairing: Temperature: Relative Humidity: Cleanliness: Air Speed inside Fairing: Noise inside Fairing: Max. Air Flow Rate: 15°C~25°C 33%~55% 100,000 level ≤2m/s ≤90dB 3000~4000m3/hour The air-conditioning is shut off at L-45 minutes and would be recovered in 40 minutes if the launch aborted. The air-conditioning inlets are shown in Chapter 4. For the fairing encapsulated in BS3, the air-conditioning begins to work after the fairing and SC mating to the Launch Vehicle. Issue 1998 6-5 LM-3C USER’S MANUAL CHAPTER 6 CALT'S PROPRIETARY Fairing Air Conditioning Control Air Flow Inlet (2) Air Flow Inlet (1) Measuring & Control Sensor Measuring: - Flow Velocity - Temperature - Humidity Exhaust Vents for Air Flow Access Door Figure 6-2 Fairing Air-conditioning on the Tower Issue 1998 6-6 LM-3C USER’S MANUAL CHAPTER 6 CALT'S PROPRIETARY 6.2.4 Electromagnetic Environment 6.2.4.1 Radio Equipment onboard LM-3C and Ground Test Equipment Characteristics of on-board radio equipment and ground test equipment are shown below: EQUIPMENT L A U N C H V E H I C L E G R O U N D Telemetry Transmitter 3 Telemetry Transmitter 2 Transponder 1 Transponder 2 Transponder 3 FREQUENCY (MHz) 2200~2300 POWER (W) 10 2200~2300 5 Rec.5840~5890 Tra.4200~4250 Rec.5860~5910 Tra.4210~4250 Rec. and Tra. 5580~5620 5 ≤-120dBW linear 2 ≤-120dBW linear 300(max) 0.8~1.0µs 800Hz Pav<300 mW 2 ≤-90dBW linear Beacon 2730~2770 Telemetry command Receiver Tester for Transponder 1 Tester for Transponder 2 Tester for Transponder 3 Telemetry Command Transmitter 550~750 Sensitivity Polarization linear linear linear ≤-128dBW 5840~5890 0.5 5870~5910 0.5 5570~5620 100W(peak) 550~750 1W linear Antenna position VEB Stage-2 Intertank Stage -2 Intertank Stage -2 Intertank Stage-3 Rear shell Stage-3 Rear shell Stage-2 Intertank Tracking & safety system ground test room at launch center Onboard radio equipment mounted positions are shown in Figure 6-3. Issue 1998 6-7 LM-3C USER’S MANUAL CHAPTER 6 CALT'S PROPRIETARY Telemetry Transmitter 3 (VEB) Tracking Transponder 3 Tracking Beacon (3rd Stage Rear Shell) Telemetry Transmitter 2 Tracking Transponder 2 Tracking Transponder 1 Telecommand Receiver (2nd Stage Intertank) Figure 6-3 On-board Radio Equipment Mounted Positions Issue 1998 6-8 LM-3C USER’S MANUAL CHAPTER 6 CALT'S PROPRIETARY 6.2.4.2 RF Equipment and Radiation Strength at XSLC Working frequency: Antenna diameter: Impulse power: Impulse width: Min. pulse duration: Mean power: 5577~5617 MHz 4.2m <1500 kW 0.0008ms 1.25ms <1.2kW 6.2.4.3 LV Electromagnetic Radiation and Susceptibility The energy levels of launch vehicle electromagnetic radiation and susceptibility are measured at 1m above VEB. They are shown in Figure 6-4 to Figure 6-6. 6.2.4.4 EMC Analysis among SC, LV and Launch Site To conduct the EMC analysis among SC, LV and launch site, both SC and LV sides should provide related information to each other. The information provided by CALT are listed as Figure 6-4 to Figure 6-6, while the information provided by SC side are as follows: a. SC RF system configuration, characteristics, working time, antenna position and direction, etc. b. Values and curves of the narrow-band electric field of intentional and parasitic radiation generated by SC RF system at SC/LV separation plane and values and curves of the electromagnetic susceptibility accepted by SC. CALT will perform the preliminary EMC analysis based on the information provided by SC side, and both sides will determine whether it is necessary to request further information according to the analysis result. 6.2.5 Contamination Control The molecule deposition on SC surface is less than 2mg/m2/week. Issue 1998 6-9 LM-3C USER’S MANUAL CHAPTER 6 CALT'S PROPRIETARY Field Strength (dBuV/m) 150 140 130 120 110 100 90 80 70 60 50 40 30 20 10 0 0.01 0.1 1 10 100 1000 10000 Frequency (MHz) Frequency (MHz) 0.01-0.05 0.05-3 3-300 300-550 550-750 750-2200 2200-2300 2300-2730 2730-2770 2770-4200 4200-4250 4250-5580 5580-5620 5620-6000 6000-6500 6500-13500 13500-15000 15000- Field Strength (dBµV/m) 80 90 70 80 103 80 134 80 107 80 107 80 99 80 48 80 42 80 Figure 6-4 Intentional Radiation from LV and Launch Site Issue 1998 6-10 LM-3C USER’S MANUAL CHAPTER 6 CALT'S PROPRIETARY Field Strength (dBpT) 120 115 110 105 100 95 90 85 80 75 70 65 60 55 50 30 300 3000 30000 Frequency (MHz) Frequency (MHz) 30-150 150-300 300-50000 Field Strength (dBpT) 100-91 (linear) 91-65 (linear) 65 Figure 6-5 Magnetic Field Radiation from LV and Launch Site Issue 1998 6-11 LM-3C USER’S MANUAL CHAPTER 6 CALT'S PROPRIETARY Field Strength (dBuV/m) 160 140 120 100 80 60 40 20 0 0.001 0.01 0.1 1 10 100 1000 10000 100000 Frequency (Mhz) Frequency (MHz) 0.01-550 550-760 760-1000 1000-5580 5580-5910 5910-18000 Field Strength (dBµV/m) 134 15 134 140 35 140 Figure 6-6 LV Electro-Magnetic Radiation Susceptibility Issue 1998 6-12 LM-3C USER’S MANUAL CHAPTER 6 CALT'S PROPRIETARY 6.3 Flight Environment 6.3.1 Pressure Environment When LM-3C launch vehicle flights in the atmosphere, the fairing air-depressurization is provided by 10 vents opened on the lower cylindrical section. The design range of fairing internal pressure is presented in Figure 6-7. The maximum depressurization rate inside fairing will not exceed 6.9kPa/sec. Pressure (Pa) 100000 80000 60000 Upper Limit 40000 Lower Limit 20000 0 0 20 40 60 80 100 Flight Time (s) Figure 6-7 Design Range of Fairing Internal Pressure during LV Flight Issue 1998 6-13 LM-3C USER’S MANUAL CHAPTER 6 CALT'S PROPRIETARY 6.3.2 Thermal environment The radiation heat flux density and radiant rate from the inner surface of each section of the fairing is shown in Figure 6-8. The free molecular heating flux at fairing jettisoning shall be lower than 1135W/m2 (See Figure 6-9). After fairing jettisoning, the thermal effects caused by the sun radiation, Earth infrared radiation and albedo will also be considered. The specific affects will be determined through the SC/LV thermal environment analysis by CALT. The LV retro-rockets will work 1.5 sec. and generate the heat flux of <300W/m2 at SC/LV separation plane. The heat flux due to third-stage engines working will not exceed 700 W/m2 at SC/LV separation plane. Heat Flux Density (W/m2) 500 450 ε =0.34 A ε =0.17 B εC =0.17 ε =0.17 D A 400 B 350 A C 300 250 D 200 D 150 B 100 C 50 0 20 40 60 80 100 120 140 160 180 200 220 Flight Time (s) Figure 6-8 Radiation Heat Flux Density and Radiant Rate on the Inner Surface of Each Section of the Fairing Issue 1998 6-14 LM-3C USER’S MANUAL CHAPTER 6 CALT'S PROPRIETARY 2 Heat Flux (W/m ) 1200 1135 (W/m2) 1000 800 600 Free Molecular Heating Flux at Fairing Jettisoning 400 200 0 0 200 400 600 800 1000 1200 1400 1600 Flight Time (s) Figure 6-9 Typical Free Molecular Heating Flux Issue 1998 6-15 LM-3C USER’S MANUAL CHAPTER 6 CALT'S PROPRIETARY 6.3.3 Static Acceleration The launch vehicle longitudinal external forces generate the static longitudinal acceleration. They mainly include engine thrust and aerodynamic force. The typical maximum longitudinal acceleration during LV powered flights are shown in the following table. It can be seen that the maximum static acceleration occurred just prior to booster separation. The maximum static acceleration will be slightly variable to different missions. Events Prior to booster separation Prior to Stage I cut-off During Stage II flight During Stage III first flight During Stage III second flight Value +5.3g +3.6g +2.8g +1.2g +2.5g Note: Here “+” means the direction of the acceleration coincides with LV +X axis. 6.3.4 Vibration Environment A. Sinusoidal Vibration The SC sinusoidal vibration mainly occurs in the processes of engine ignition and shut-off, transonic flight and stage separations. The sinusoidal vibration (zero-peak value) at SC/LV interface is shown below. Direction Longitudinal Lateral Frequency Range (Hz) 5-8 8 - 100 5-8 8 - 100 Amplitude & Acceleration 3.11 mm 0.8g 2.33 mm 0.6 g B. Random Vibration The SC random vibration is mainly generated by noise and reaches the maximum at the lift-off and transonic flight periods. The random vibration Power Spectral Density and the total Root-Mean-Square (RMS) value at SC/LV separation plane in three directions are given in the table below. Issue 1998 6-16 LM-3C USER’S MANUAL CHAPTER 6 CALT'S PROPRIETARY Frequency Range (Hz) 20 - 200 200 - 800 800 - 2000 Power Spectral Density 6 dB/octave. 2 0.04 g /Hz -3 dB/octave. Total RMS Value 7.48 g 6.3.5 Acoustic Noise The flight noise mainly includes the engine noise and aerodynamic noise. The maximum acoustic noise suffered by SC occurs at the moment of lift-off and during the transonic flight phase. The values in the table below are the maximum noise levels in fairing. Central Frequency of Octave Bandwidth (Hz) 31.5 63 125 250 500 1000 2000 4000 8000 Total Acoustic Pressure Level -5 0 dB referenced to 2×10 Pa. Acoustic Pressure Level (dB) 120 126 132 136 135 132 127 123 116 141 6.3.6 Shock Environment The maximum shock that SC suffered occurs at the SC/LV separation. The shock response spectrum at SC/LV separation plane is shown bellow. Frequency Range (Hz) Response Acceleration (Q=10) 100-1500 9.0 dB/octave. 1500-4000 4000 g Issue 1998 6-17 LM-3C USER’S MANUAL CHAPTER 6 CALT'S PROPRIETARY 6.4 Load Conditions for SC Design 6.4.1 Frequency Requirement To avoid the SC resonance with LM-3C launch vehicle, the primary frequency of SC structure should meet the following requirement (under the condition that SC/LV separation plane is considered as rigid body): The frequency of the lateral main mode>10Hz The frequency of the longitudinal main mode >30Hz 6.4.2 Loads Applied for SC Structure Design The maximum lateral load occurs at the transonic phase or Maximum Dynamic Pressure phase. The maximum axial static load occurs prior to the boosters’ separation. The maximum axial dynamic load occurs after the first and second stage separation. Therefore, the following limit loads corresponding to different conditions in flight are recommended for SC design consideration. Flight Condition Longitudinal Acceleration(g) Lateral Acceleration(g) Transonic phase Prior to booster After 1st/2nd and MDP separation stage separation Static Dynamic Combined +2.2 +0.8 -0.8 +3.0 +5.3 +0.8 -3.6 +6.1 Combined 1.5* 1.0 +1.0 +2.7 -3.6 +3.7 -2.6 1.0 Notes: n Here “*” means that 1.5g is effective only under the following conditions: The SC frequency meets the requirement in Paragraph 6.4.1, the mass of SC ≤ 5100kg, C.G location of the SC relative to the SC/LV separation plane≤1.6m. For specific SC, the figure 1.5g may be larger. The User should consult with CALT to determine the accurate load conditions according to the specific SC conditions o Usage of the above table: Issue 1998 6-18 LM-3C USER’S MANUAL CHAPTER 6 CALT'S PROPRIETARY SC design loads = Limit loads Safety factor* × * The safety factor is determined by the SC designer. p The lateral load means the load acting in any direction perpendicular to the longitudinal axis. q Lateral and longitudinal loads occur simultaneously. r The plus sign "+" means compression in longitudinal. 6.4.3 Coupled Load Analysis The SC manufacturer should provide the SC mathematical model to CALT for Coupled Loads Analysis (CLA) to CALT. CALT will predict the SC maximum dynamic response by coupled load analysis. The SC manufacturer should confirm that the SC could survive from the predicted environment and has adequate safe margin. (CALT requires that the safe factor is equal to or greater than 1.25.) 6.5 SC Qualification and Acceptance Test Specifications 6.5.1 Static Test (Qualification) The main SC structure must pass static qualification tests without damage. The test level must be not lower than SC design load required in Paragraph 6.4.2. 6.5.2 Vibration Test A. Sine Vibration Test During tests, the SC must be rigidly mounted on the shaker. The table below specifies the vibration acceleration level (0 - peak) of SC qualification and acceptance tests at SC/LV interface. (See Figure 6-10) Longitudinal Lateral Frequency (Hz) 5-8 8-100 5-8 8-100 Test Load Acceptance Qualification 3.11 mm 4.66 mm 0.8 g 1.2 g 2.33 mm 3.50 mm 0.6 g 0.9 g 4 2 Scan rate (Oct/min) Notes: • Frequency tolerance is allowed to be ±2% • Amplitude tolerance is allowed to be -0 ~ +10% • Acceleration notching is permitted after consultation with CALT and concurred by all parties. Anyway, the notched acceleration should not be lower than the Issue 1998 6-19 LM-3C USER’S MANUAL CHAPTER 6 CALT'S PROPRIETARY coupled load's analysis results on the interface plane. Acceleration (g) Axial Qua. Level 1.2g Lateral Qua. Level 0.9g 1 Axial Acc. Level 0.8g Lateral Acc. Level 0.6g 0.1 1 10 100 Frequency (Hz) Figure 6-10 Sinusoidal Vibration Acceleration Level of SC Qualification and Acceptance Tests Issue 1998 6-20 LM-3C USER’S MANUAL CHAPTER 6 CALT'S PROPRIETARY B. Random Vibration Test During tests, the SC structure must be rigidly mounted onto the shaker. The table below specifies the SC qualification and acceptance test levels at SC/LV interface in three directions (See Figure 6-11). Frequency (Hz) Acceptance Spectrum Density Total rms (Grms) 6 dB/octave. 7.48g 0.04 g2/Hz -3 dB/octave. 1min. Qualification Spectrum Density Total rms (Grms) (g2/Hz) 6 dB/octave. 11.22g 0.09 g2/Hz -3 dB/octave 2min. 20 - 200 200 - 800 800 - 2000 Duration Notes: • Tolerances of ±3.0 dB for power spectral density and ±1.5 dB for total rms values are allowed. • The random test can be replaced by acoustic test. 2 Power Spectrum Density (g /Hz) 0.1 Qualification Level Acceptance Level 0.01 0.001 0.0001 10 100 1000 10000 Frequency (Hz) Figure 6-11 Random Vibration Acceleration Level of SC Qualification and Acceptance Tests Issue 1998 6-21 LM-3C USER’S MANUAL CHAPTER 6 CALT'S PROPRIETARY 6.5.3 Acoustic Test The acceptance and qualification test levels are given in the following table (also see Figure 6-12). Central Octave Acceptance Sound Frequency (Hz) Pressure Level (dB) 31.5 120 63 126 125 132 250 136 500 135 1000 132 2000 127 4000 123 8000 116 Total Sound 141 Pressure Level -5 0 dB is equal to 2×10 Pa. Test Duration: 5 Acceptance test: 1.0 minute 5 Qualification test: 2.0 minutes 145 Qualification Sound Pressure Level (dB) 124 130 136 140 139 136 131 127 120 145 Tolerance (dB) -2/+4 -5/+4 -5/+5 -1/+3 Sound Pressure Level (dB) 140 Qualification Level 135 130 125 Acceptance Level 120 115 110 10 100 1000 10000 Frequency (Hz) Figure 6-12 SC Acoustic Test Issue 1998 6-22 LM-3C USER’S MANUAL CHAPTER 6 CALT'S PROPRIETARY 6.5.4 Shock Test The shock test level is specified in Paragraph 6.3.6. Such test shall be performed once for acceptance, and twice for qualification. A ±6.0 dB tolerance in test specification is allowed. However, the test strength must be applied so that in the shock response spectral analysis over 1/6 octave on the test results, 30% of the response acceleration values at central frequencies shall be greater than or equal to the values of test level. (See Figure 6-13) The shock test can also be performed through SC/LV separation test by using of flight SC, payload adapter, and separation system. Such test shall be performed once for acceptance, and twice for qualification. Acceleration (g) 10000 1000 100 10 100 1000 10000 Frequency (Hz) Frequency Range (Hz) 100~1500 1500~4000 Shock Response Spectrum (Q=10) 9.0dB/octave 4000g Figure 6-13 Shock Response Spectrum at SC/LV Separation Plane Issue 1998 6-23 LM-3C USER’S MANUAL CHAPTER 6 CALT'S PROPRIETARY 6.5.5 Proto-flight Test The Proto-flight test is suitable for the SC that is launched by LM-3C for the first time even though it has been launched by other launch vehicles. The test level for the Proto-flight should be determined by satellite manufacturer and CALT and should be higher than the acceptance level but lower than the qualification level. If the same satellite has been tested in the conditions that are not lower than the qualification test level described in Paragraph 6.5.2 to Paragraph 6.5.4, CALT will suggest the following test conditions: a. Vibration and acoustic test should be performed according to the qualification level and acceptance test duration or scan rate specified in Paragraph 6.5.2-6.5.3. b. Shock test should be performed once according to the level in Paragraph 6.5.4. 6.6 Environment Parameters Measurement The inner environment of fairing is measured during each flight. The measuring parameters include temperature and pressure inside the fairing, noises inside and outside the fairing ands the vibration parameters at SC/LV interface. Issue 1998 6-24
