Urbanization in China and population exposure
advertisement
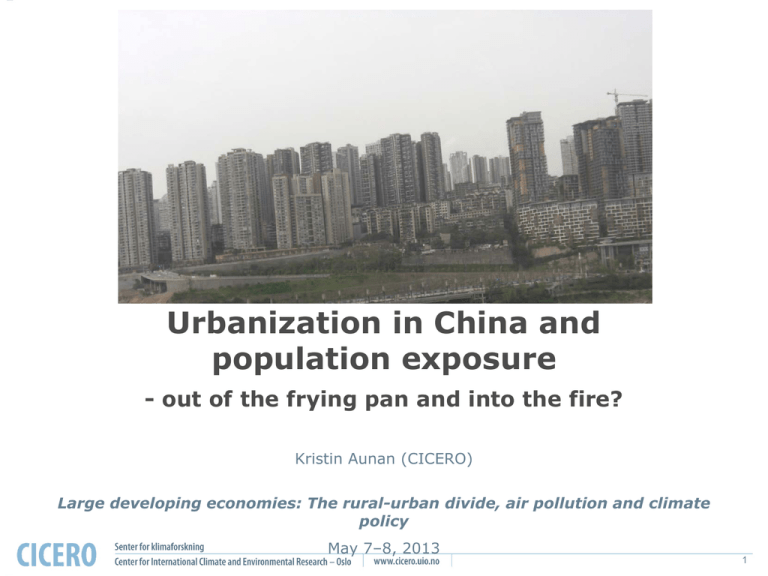
Urbanization in China and population exposure - out of the frying pan and into the fire? Kristin Aunan (CICERO) Large developing economies: The rural-urban divide, air pollution and climate policy May 7–8, 2013 1 2 Urban air quality in China is improving Annual PM10 concentration in 86 key cities 2001-2011 China Class II standard WHO guideline 3 PM10 in rural kitchen – raditional solid fuels (> 500 µg/m3 PM10) Indoor air pollution from solid fuel use dwarfs ambient levels in cities 4 Incomplete combustion in traditional cookstoves • ~10% of the fuel carbon is converted into ‘Products of Incomplete Combustion’ (PIC) (instead of producing heat…) • Hundreds of common PICs are toxic and carcinogenic: Fine particles, CO, PAH, oxygenated organics, chlorinated organics • The smoke reaches peoples’ lungs: Intake fraction is high 5 Exposure is a function of time activity pattern and concentration levels PM2.5 (µg/m3) Cooking with tradition fuels (also affects living rooms) makes the big difference for the exposure, particularly for women but also for men Data for women from Guizhou (summer) (Aunan et al., 2013) 6 Dirty household fuels: A main source of short-lived climate forcers • BC (black carbon – soot) the second most important single component when it comes to global warming, after CO2 (Bond et al. 2013) • Household solid fuels is the second largest BC source in the world (after open burning of forest/crop land etc) - ¼ of global BC emissions 7 Switch to clean household fuels is the most important mitigation option for black carbon abatement (UNEP, 2011) 53% 8 Household fuels in China: Nearly half of the households lack clean fuels Data from China Census 2010 10 Fuel distribution 2000 and 2010 11 2000 2010 12 Household fuel transition 2000–2010 • 346 million more people use clean fuels • 145 million fewer coal users • 110 million fewer biomass users 55% 10% 80% 23% 13 Energy poverty disparity increasing? -biomass share is stable in rural areas 64% 60% 14 Impacts on exposure of migration Guizhou • Moving from rural areas: Household Air Pollution (’traditional air pollution sources’) Beijing • Moving to urban areas: Traffic and industry (’modern air pollution sources’) 15 Migrant flows (China Census 2010) • 261 mill migrants • 227 million settled in urban areas • 138 mill rural-urban migrants • 52% are men • 67% are intraprovincial migrants 16 Previous (2000) and current (2010) settlement of migrants (Example shown for migrants to Guangdong) 17 Migrants to Shanghai 18 We assume fuel use profile in migrants is average for settlement region both in 2000 and 2010 (figure shows 2010 distribution) 19 20 Population weighted exposure given fuel and settlement (µg/m3 PM2.5, S.D.) Urban Rural North South North South Clean 142 (18) 84 (18) 82 (7) 55 (7) Coal 174 (18) 137 (22) 206 (15) 286 (28) Biomass 440 (77) 485 (132) 433 (52) 496 (84) (From Mestl et al 2007) 21 Disentangling the impact on population exposure of migration • Our data allows us to calculate population weighted exposure (PWE) for the total population and for any sub-population (place i, fuel j): PWEP = 1 P ∑ (P i, j • PWEi , j ) i, j • By definition we know that population exposure (PE) for any population is: PEP = PWEP x P (unit µg/m3pop) and PEtot_P = PEmigrant_P + PEnon-migrant_P 22 ..thus the attribution of migration to reduced population exposure over the decade is given by the share of ∆PEmigrants of ∆PE tot pop ~60% 23 Estimated PWE 2000 and 2010 52 (36-70) 24 ∆PWE for total population is 52 µg/m3 PM2.5 – decomposition: 25 Estimates for 8 largest host provinces PWE 2000 PWE 2010 ∆PWE Migrant pop (mill) Guangdong 309 117 192 36,8 Zhejiang 317 118 199 19,9 Jiangsu 315 160 155 18,2 Shandong 308 203 106 13,7 Shanghai 255 94 161 12,7 Sichuan 320 199 122 11,7 Fujian 309 120 189 11,1 Beijing 251 150 102 10,5 Migrants to: 26 Uncertainties • Are the migrants representative for the area (N/S, urban/rural) from where they left and for the area where they settle down? – Education level above average 27 ..but primarily for intraprovincial migrants 28 Uncertainties cont. • Are the migrants representative for the area (N/S, urban/rural) from where they left and for the area where they settle down? – Education level above average – Income level lower (?) 29 Large differences between intraand interprovincial migrants Reason for migrating Total migrants Intraprovincial migrants (67%) Interprovincial migrants (33%) Manual labour 45% 31% 75% Education 11% 15% 4% Dependents of migrants 14% 17% 9% Demolition of old residence or moving 9% 13% <1% Figures from Zai Liang 2012, based on China Census data 30 Uncertainties cont. • Are the migrants representative for the area (N/S, urban/rural) from where they left and for the area where they settle down? – Education level above average – Income level lower (?) – Age group more narrow • Probably some changes in average indoor and outdoor pollution levels 2000-2010 • Working environment exposure not included • Assumed PM2.5/PM10 ratio • No measurements for floating population – except in Shanghai 31 Clean fuel in Shanghai (exposure to PM2.5 from indoor and outdoor environments) Urban Suburban and rural Lejnarova thesis Used here (Mestl et al 07) ~80 84 (urban S) ~60-70 55 (rural S) 32 Rural Guizhou (South) and Shanxi (North) - exposure to PM2.5 from indoor and outdoor environments (own estimates) RURAL Used here (Mestl et al 07) Guizhou BIOMASS_No chimney 381(±29) 496(±84) (rural S) Guizhou BIOMASS_Chimney 308(±40) 496(±84) (rural S) 162 55(±7) (rural S) Guizhou ~CLEAN (gas+?) Guizhou COAL_Chimney (..180 – 600..) 286(±28) (rural S) Shanxi COAL_Chimney 163 206(±15)(rural N) Shanxi CLEAN (electr.) 106 82(±7)(rural N) U 174 U 142 33 Summary • Rural energy transition is happening, but still most rural households do not have clean fuels • The dose is the demon: Household air pollution still a larger cause of PM2.5 exposure and ill health • Increasing rural-urban energy poverty disparities • Rural-urban migration 2000-2010 has reduced exposure considerably, for the individual and on a population basis. ‘Out of the frying pan.’ 34
