STATISTICS 402 - Assignment 3
advertisement
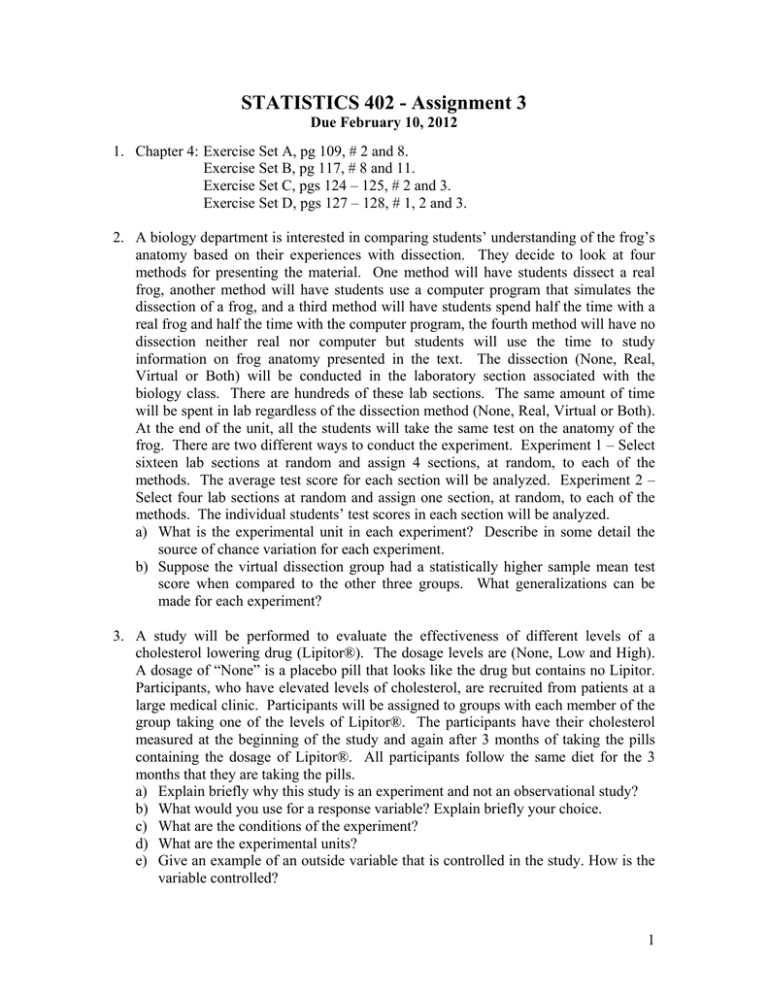
STATISTICS 402 - Assignment 3 Due February 10, 2012 1. Chapter 4: Exercise Set A, pg 109, # 2 and 8. Exercise Set B, pg 117, # 8 and 11. Exercise Set C, pgs 124 – 125, # 2 and 3. Exercise Set D, pgs 127 – 128, # 1, 2 and 3. 2. A biology department is interested in comparing students’ understanding of the frog’s anatomy based on their experiences with dissection. They decide to look at four methods for presenting the material. One method will have students dissect a real frog, another method will have students use a computer program that simulates the dissection of a frog, and a third method will have students spend half the time with a real frog and half the time with the computer program, the fourth method will have no dissection neither real nor computer but students will use the time to study information on frog anatomy presented in the text. The dissection (None, Real, Virtual or Both) will be conducted in the laboratory section associated with the biology class. There are hundreds of these lab sections. The same amount of time will be spent in lab regardless of the dissection method (None, Real, Virtual or Both). At the end of the unit, all the students will take the same test on the anatomy of the frog. There are two different ways to conduct the experiment. Experiment 1 – Select sixteen lab sections at random and assign 4 sections, at random, to each of the methods. The average test score for each section will be analyzed. Experiment 2 – Select four lab sections at random and assign one section, at random, to each of the methods. The individual students’ test scores in each section will be analyzed. a) What is the experimental unit in each experiment? Describe in some detail the source of chance variation for each experiment. b) Suppose the virtual dissection group had a statistically higher sample mean test score when compared to the other three groups. What generalizations can be made for each experiment? 3. A study will be performed to evaluate the effectiveness of different levels of a cholesterol lowering drug (Lipitor®). The dosage levels are (None, Low and High). A dosage of “None” is a placebo pill that looks like the drug but contains no Lipitor. Participants, who have elevated levels of cholesterol, are recruited from patients at a large medical clinic. Participants will be assigned to groups with each member of the group taking one of the levels of Lipitor®. The participants have their cholesterol measured at the beginning of the study and again after 3 months of taking the pills containing the dosage of Lipitor®. All participants follow the same diet for the 3 months that they are taking the pills. a) Explain briefly why this study is an experiment and not an observational study? b) What would you use for a response variable? Explain briefly your choice. c) What are the conditions of the experiment? d) What are the experimental units? e) Give an example of an outside variable that is controlled in the study. How is the variable controlled? 1 f) Give an example of an outside variable that is not controlled in the study? Explain briefly. In your explanation you should indicate why this variable should be controlled. g) Is there a control group in this study? h) Is random selection used in this study? Explain briefly. i) Suppose the experimenter wanted to be able to detect a 0.9 standard deviation difference in group means with Alpha = 0.10 and Beta = 0.05, how many volunteers would be needed for the experiment? j) Fifty four people volunteer for the experiment. Give two combinations of Alpha, Beta and the size of the detectable difference in group means that correspond to this number of volunteer. k) Describe in detail how you would randomly assign the dosages to the participants so that there are an equal number (18) of participants getting each dosage. Once you have described what you will do, actually do the randomization. Include your randomized assignment of the 54 volunteers to the 3 groups. l) Is there replication within this experiment? Explain briefly. 4. A one factor, completely randomized experiment, as described in problem 3, is run. The results appear on the next page. a) Plot the data and compute summary statistics. If you use a computer program, “cut and paste” the output on your answer sheet. Based on the plot what can you say about the effectiveness of the various doses? What can you say about the variability within each dose? b) Estimate the effect of each of the dosages. c) Construct an analysis of variance table giving sources of variation, degrees of freedom, sums of squares, mean squares, appropriate F statistic and associated Pvalue. If you use a computer package, you can copy the results from the output onto your answer sheet. I will not look at output simply attached at the end of what you turn in. d) Give the value of R2 and an interpretation of this value. e) Are there statistically significant differences amongst the three groups in terms of sample mean change in cholesterol level? Support your answer by referring to the appropriate test of the null hypothesis: H 0 : 1 2 3 0 . f) Construct 95% confidence intervals for the differences in true mean change in cholesterol. None compared to Low Low compared to High None compared to High g) Based on the confidence intervals in f), what pairs of treatments have differences in sample means that are statistically significant? h) Write a brief summary (one or two sentences is enough) of the findings of the experiment. In this summary make a recommendation based on your analysis as to what dosage of Lipitor® should be used. 2 Data for Lipitor® Experiment Change in Cholesterol Level (After – Before) None –33 –26 –19 –65 –9 –43 –25 51 55 –38 –22 9 –8 –33 –8 23 –5 34 Low –12 –46 –6 –23 –41 –40 –32 –65 –8 –59 –26 19 –30 –34 –52 –40 –1 –44 High –8 –12 –39 –27 –32 –13 –18 –55 13 6 –43 –37 –56 –61 –3 –49 –58 –84 3
