Stat 401G Lab 1 Solution
advertisement
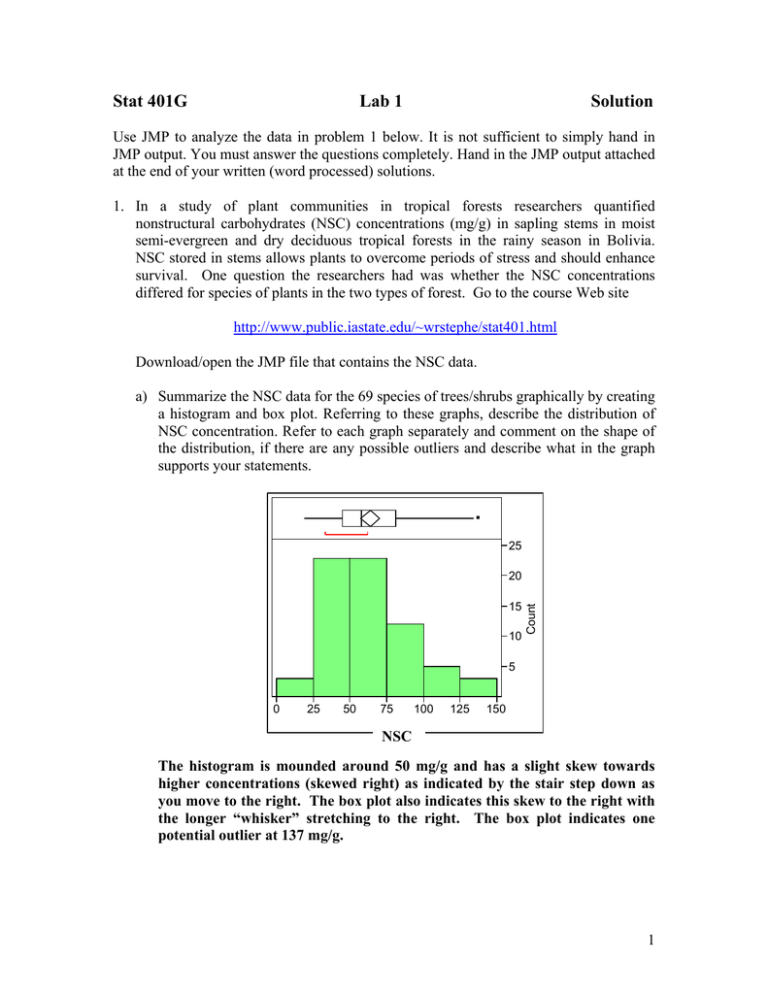
Stat 401G Lab 1 Solution Use JMP to analyze the data in problem 1 below. It is not sufficient to simply hand in JMP output. You must answer the questions completely. Hand in the JMP output attached at the end of your written (word processed) solutions. 1. In a study of plant communities in tropical forests researchers quantified nonstructural carbohydrates (NSC) concentrations (mg/g) in sapling stems in moist semi-evergreen and dry deciduous tropical forests in the rainy season in Bolivia. NSC stored in stems allows plants to overcome periods of stress and should enhance survival. One question the researchers had was whether the NSC concentrations differed for species of plants in the two types of forest. Go to the course Web site http://www.public.iastate.edu/~wrstephe/stat401.html Download/open the JMP file that contains the NSC data. a) Summarize the NSC data for the 69 species of trees/shrubs graphically by creating a histogram and box plot. Referring to these graphs, describe the distribution of NSC concentration. Refer to each graph separately and comment on the shape of the distribution, if there are any possible outliers and describe what in the graph supports your statements. 25 15 10 Count 20 5 0 25 50 75 100 125 150 NSC The histogram is mounded around 50 mg/g and has a slight skew towards higher concentrations (skewed right) as indicated by the stair step down as you move to the right. The box plot also indicates this skew to the right with the longer “whisker” stretching to the right. The box plot indicates one potential outlier at 137 mg/g. 1 b) Summarize the data numerically and report a five number summary, the sample mean and sample standard deviation for the entire sample of 69 species. Minimum = 19 mg/g, Lower quartile = 45 mg/g, Median = 58 mg/g, Upper quartile = 81 mg/g, Maximum = 137 mg/g sample mean = 63.6 mg/g sample standard deviation = 27.42 mg/g c) What does the comparison of the mean to the median tell you about the shape of the distribution of values? The fact that the sample mean is higher than the sample median supports the notion that the distribution is skewed toward higher values (skewed right). The mean will be pulled in the direction of the skew. d) Report the 95% confidence interval for the population mean NSC concentration. Give an interpretation of this interval and the confidence level. The 95% confidence interval for the population mean NSC concentration is from 57.05 mg/g to 70.23 mg/g. This interval provides plausible values for the population mean NSC concentration for tropical forest trees/shrubs. 95% confidence tells us that if we were to create many intervals, like the one above, based on random samples from the population, about 95% of those intervals would capture the population mean NSC concentration. e) Test the hypothesis that the population mean NSC concentration is 55 mg/g against an alternative that the population mean NSC concentration is greater than 55 mg/g. H 0 : 55 H A : 55 t 63.64 55 2.617 27.423 69 P value 0.0055 Because the P-value is so small, reject the null hypothesis. The population mean NSC concentration is greater than 55 mg/g. 2 f) Use JMP to create residuals by subtracting off the sample mean from each of the 69 NSC concentrations. Use Analyze + Distribution to create JMP output that looks at the distribution (histogram, box plot and Normal Quantile Plot) of the 69 residuals. 3 .99 2 .95 .90 1 .75 .50 0 Normal Quantile Plot Residual (NSC concentrations) .25 .10 .05 -1 -2 .01 -3 25 15 Count 20 10 5 -60 -40 Species Ocotea sp. 2 -20 Forest Moist 0 20 40 NSC 137 60 80 100 Residual (one-sample) 73.3623188 3 g) Refer to the histogram of residuals and indicate what you see and what this tells you about the condition that the random errors are normally distributed. The histogram of residuals is mounded between –20 and 0. There is a skew toward larger values (skewed right) as indicated by the stair step pattern down to the right. The skewed shape is an indication that the NSC concentrations may not be normally distributed. h) Refer to the box plot of residuals. Are there any possible outliers? If so, what are the corresponding NSC concentrations, species and type of forest? What does the box plot tell you about the condition of identically distributed random errors? The box plot shows that there is a potential outlier for the largest positive residual. This corresponds to the species Ocotea sp. 2 in a moist forest with NSC concentration of 137 mg/g. Because of this potential outlier, the condition of identically distributed random errors may not be met. i) Refer to the Normal Quantile Plot of residuals and indicate what you see and what this tells you about the condition that the random errors come from a normal distribution. The normal quantile plot shows a curved pattern. The residuals start off below the diagonal line representing a normal model, curve above and then below the diagonal line. This is consistent with the right skewed shape of the histogram. Because of this curved pattern, the condition that the random errors come from a normal distribution may not be met. j) Summarize what you have learned about the conditions necessary for the statistical analysis of the NSC concentrations from your analysis of the residuals. There are problems with the residuals. Both the histogram and the normal quantile plot indicate a right skewed distribution. This puts the condition of normally distributed random errors in doubt. The potential outlier puts the condition of identically distributed random errors in doubt. 4 2. On a separate piece of paper write a brief summary of what you have learned about NSC concentrations in trees/shrubs in tropical forests. NSC concentrations in 69 species of trees/shrubs in tropical forests vary from about 20 mg/g to about 140 mg/g. A majority of the NSC concentrations are between 25 and 75 mg/g. The average NSC concentration is 63.6 mg/g, which is slightly higher than the median NSC concentration of 58 mg/g. The population mean NSC concentration is likely more than 55 mg/g. This statement is supported by a test of hypothesis (P-value = 0.0055) and a 95% confidence interval that indicates that possible values for the population mean NSC concentration are between 57.05 mg/g and 70.23 mg/g. There are some issues as to whether the conditions for statistical inference are met. The P-value may not be exactly as reported, however, there is still strong evidence that the population mean NSC concentration is greater than 55 mg/g. Additionally, the confidence level may be less than the stated value of 95%. 5

